How to configure Prometheus-Operator & scrape metrics from Istio 1.6
How do you get Istio metrics in Prometheus The way that observability metrics are created, exchanged, and scraped has changed for Istio versions Istio

How do you get Istio metrics in Prometheus
The way that observability metrics are created, exchanged, and scraped has changed for Istio versions Istio 1.4 and up.
Here is how I configure Prometheus-Operator resources to scrape metrics from Istio 1.6 and install the latest Grafana Dashboards.
- Step 1: Install Prometheus Operator
- Step 2: Prometheus control plane configuration
- Step 3: Data plane pods to set up scraping
- Step 4: Configured service discovery result
- Step 5: Install Istio dashboards for Grafana
![]()
Tetrate offers an enterprise-ready, 100% upstream distribution of Istio, Tetrate Istio Subscription (TIS). TIS is the easiest way to get started with Istio for production use cases. TIS+, a hosted Day 2 operations solution for Istio, adds a global service registry, unified Istio metrics dashboard, and self-service troubleshooting.
Install Prometheus and create a ServiceMonitor for Prometheus-operator
Prometheus-Operator is far more dynamic than the default Prometheus install. It adds some CRD to dynamically and transparently re-configure your Prometheus cluster.
A ServiceMonitor is a resource describing which pods to scrape based on a Service.
In Istio 1.6+ we have two types of things to monitor: Istio control-plane resources and Istio-proxy data-plane.
For that we create 2 different ServiceMonitor resources:
Configuring Prometheus operator to monitor Istio control plane
apiVersion: monitoring.coreos.com/v1
kind: ServiceMonitor
metadata:
  name: prometheus-oper-istio-controlplane
  labels:
    release: prometheus
spec:
  jobLabel: istio
  selector:
    matchExpressions:
      - {key: istio, operator: In, values: [mixer,pilot,galley,citadel,sidecar-injector]}
  namespaceSelector:
    any: true
  endpoints:
  - port: http-monitoring
    interval: 15s
  - port: http-policy-monitoring
    interval: 15s
If you know a bit of Prometheus, this is pretty easy to read:
- look for any service with label
istioequals tomixer,pilot… - scrape port named
http-monitoringandhttp-policy-monitoringevery 15s
The only thing to be careful about are the labels at the beginning: they are selectors that MUST match the Prometheus install serviceMonitorSelector. If you fail to do so, Prometheus will not consider this resource.
You can check how yours is configured by looking at the prometheus resource:
kubectl get prometheus  -o yaml | grep -A4 serviceMonitorSelector
serviceMonitorSelector:
      matchLabels:
        release: prometheus
In my case, it is release: prometheus
As you can see from my example, this Prom Operator was installed using Helm. I know… sorry…
Configuring Prometheus operator to monitor Istio data plane
The Data-Plane resource is quite the same but is targeting all the Istio-Proxy containers and adds some relabeling:
apiVersion: monitoring.coreos.com/v1
kind: ServiceMonitor
metadata:
  name: prometheus-oper-istio-dataplane
  labels:
    monitoring: istio-dataplane
    release: prometheus
spec:
  selector:
    matchExpressions:
      - {key: istio-prometheus-ignore, operator: DoesNotExist}
  namespaceSelector:
    any: true
  jobLabel: envoy-stats
  endpoints:
  - path: /stats/prometheus
    targetPort: http-envoy-prom
    interval: 15s
    relabelings:
    - sourceLabels: [__meta_kubernetes_pod_container_port_name]
      action: keep
      regex: '.*-envoy-prom'
    - action: labelmap
      regex: "__meta_kubernetes_pod_label_(.+)"
    - sourceLabels: [__meta_kubernetes_namespace]
      action: replace
      targetLabel: namespace
    - sourceLabels: [__meta_kubernetes_pod_name]
      action: replace
      targetLabel: pod_name
Again, pure Prom config. Just make sure you have the right label so the Operator will take care of the resource.
Add a label istio-prometheus-ignore=”true” to your deployments in case you don’t want Prometheus to scrape the proxy’s metrics.
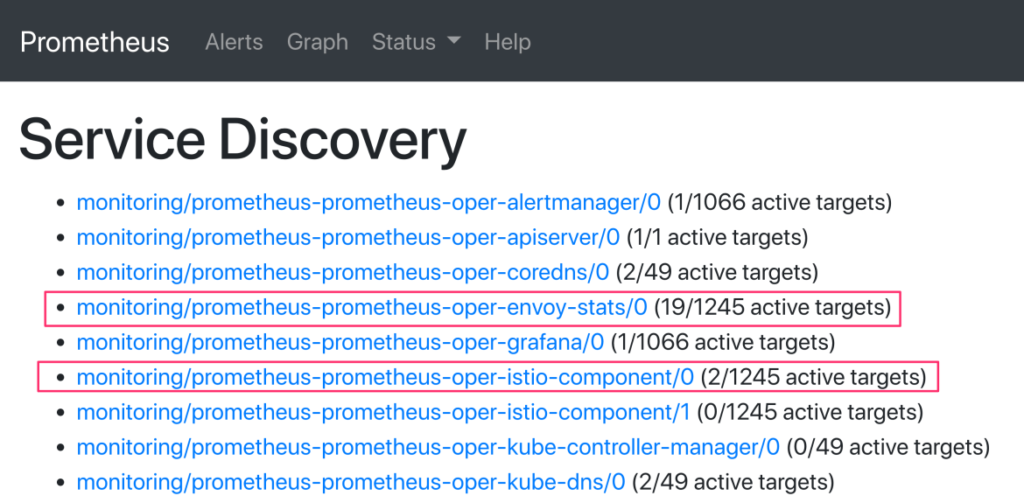
Service discovery result
After few seconds for the whole thing to settle, you can connect to your Prom frontend, using Port-Forward on port 9090 or using the Istio Ingress-Gateway that you configured with SSL cert using SDS (check my older posts).
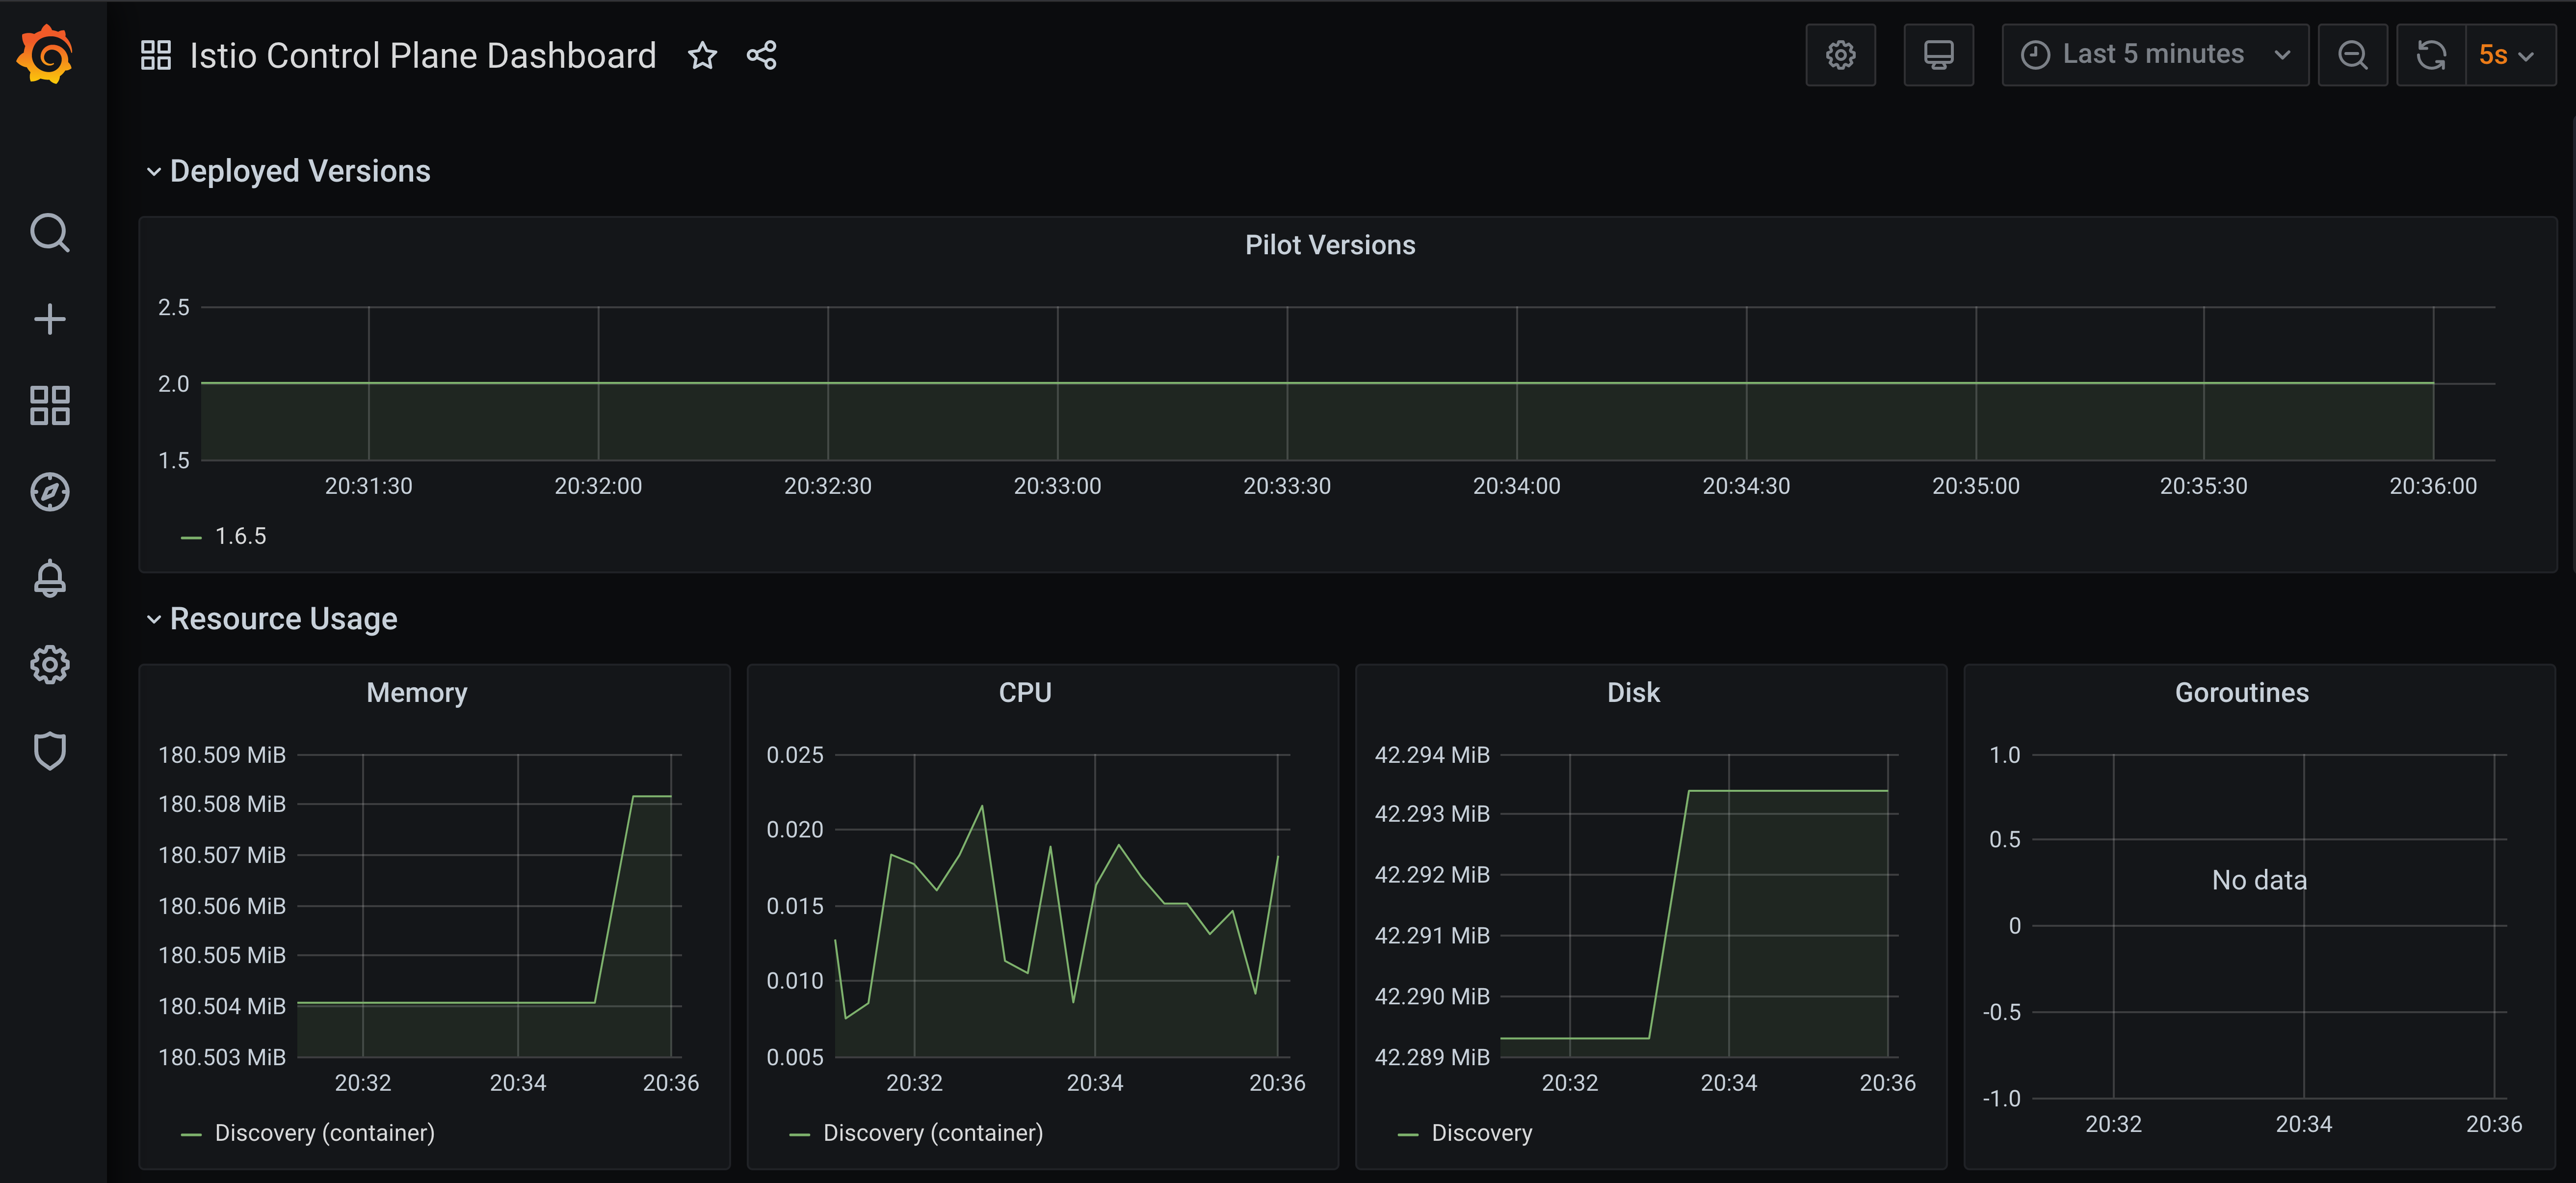
How to enable Istio dashboard in Grafana
Now that you have Istio Telemetry V2 into your Prometheus cluster, you maybe want to see the graphs with Grafana.
Glad you’ve read this far. I know this blog is missing some pictures and colors… but who cares, we are engineers right?
Istio Dashboards for Grafana are stored in many places. You can find the latest in the Istio Github repo, but the best solution for you is to grab the one that matches your Istio install from the Istio install zip (or tar) where you grabbed istioctl !
From Istio docs, get it with:
curl -L [https://istio.io/downloadIstio](https://istio.io/downloadIstio) | sh -This will create a folder with all the Istio stuffs. Note that Addons (Grafana, Kiali, Prometheus..) will NOT be managed by istioctl quite soon. You can find all the deployment scripts in this folder.
Dashboards are also located in this folder (istio-1.6.7 as the time of this writing) at manifests/charts/istio-telemetry/grafana/dashboards/
For them to be used by Grafana (the one installed by Prom Operator), you need to copy them inside a secret. Here’s the script I use for that (do a cd istio-<your-version>before using it):
#!/bin/bash

# go into the dashboards folder
pushd manifests/charts/istio-telemetry/grafana/dashboards

# create the basic command to create the configmap
ISTIO_DASHBOARD_SECRET="kubectl -n monitoring create cm prometheus-oper-istio-dashboards "

# append each file to the secret
for i in *.json ; do
  echo $i
  ISTIO_DASHBOARD_SECRET="${ISTIO_DASHBOARD_SECRET} --from-file=${i}=${i}"
done

# run the secret creation command
eval $ISTIO_DASHBOARD_SECRET

# label the configmap so it is used by Grafana
kubectl label -n monitoring --overwrite cm prometheus-oper-istio-dashboards grafana_dashboard=1

popd
Restart the Grafana pod and you should see the Dashboards in Grafana: