How to use Envoy’s Postgres filter for network observability
Starting with release 1.15.0 Envoy proxy supports decoding of Postgres messages for statistics purposes. This feature allows for an aggregated view of

Starting with release 1.15.0 Envoy proxy supports decoding of Postgres messages for statistics purposes. This feature allows for an aggregated view of the types of Postgres transactions happening in the network. That aggregated view instantly provides a breakdown of types of Postgres operations and the number and severity of errors. Presented in a time series format allows for a clear overview of how the error rate of composition of queries changed over time.
It is important to stress the fact that statistics are not gathered at the Postgres server or the client, but at the network level by sniffing messages exchanged between an application and Postgres server.Through this piece, you’ll be walked through how the background works for this new feature, and at the end there’s a quick exercise for you, to show how to run it. This blog posting is aimed at systems engineers interested in learning how Envoy may help with decomposition of Postgres traffic in the network.
Observing Postgres Network Traffic with Envoy
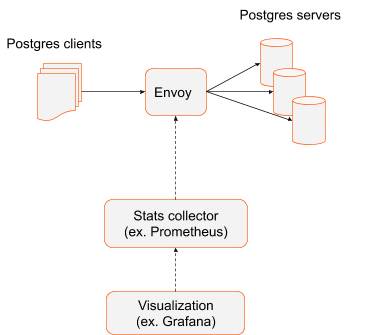
When Envoy is deployed as a load balancer in front of Postgres servers, all database transactions must naturally pass through Envoy and it is fairly easy to collect statistics.


In this scenario, where Envoy acts as load balancer, there are no architectural requirements for Postgres clients. They could be monolithic, large applications or could be a distributed system using Postgres database. The important architectural fact is that Envoy acts as a gateway to a cluster of Postgres servers and every Postgres transaction must pass through Envoy. In this scenario the number of Envoys is limited and rather static. Most likely there will be more than one instance of Envoy for availability and to avoid single point of failure. Pointing Prometheus to scrape Envoys’ metrics is trivial and can be done via static configuration.
Observing Postgres Network Traffic within a Service Mesh
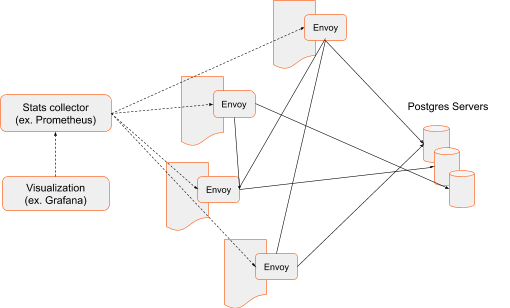
When a service mesh is used as an architectural pattern, each application has an attached Envoy sidecar that intercepts the application’s network traffic. Compared to front-proxy architecture, the number of Envoys is larger and the stats collector must gather the data from each Envoy instance. In addition, applications (and associated sidecar Envoys) may be ephemeral – they may come up on demand, may be shut down or moved to run on different hosts. Tracking instances of Envoys and pointing stats collectors to all current instances of Envoys becomes harder and cannot be done by static config. Service mesh architectures employ a control plane which tracks applications, sidecars and their endpoints and can feed that information to the stats collector. The result is the same though. Every Postgres message occurring in the network is analyzed and used to generate statistics.


Sidecar architecture is de facto standard in distributed systems. While here we concentrate on the fact that it’s easy to gather statistics– because the fleet of sidecar Envoys capture all traffic exchanged between applications and Postgres servers– there are many more benefits of such architecture. For example, Envoy can detect the failure of a Postgres instance and route requests to healthy servers, avoiding ones in an unhealthy state.
How it works
The following paragraphs describe steps to bring up a simple front-proxy scenario, generate semi-random Postgres traffic, and graphically represent various types of Postgres messages occurring in the network. The configuration code snippets highlight the most important aspects of configuration. The entire set of files can be downloaded here https://github.com/tetratelabs/envoy-postgres-stats-example. Individual parts of the setup, like Envoy, Postgres server, Postgres client, Prometheus and Grafana are brought up as containers and tied together by Docker Compose.
Envoy Configuration
The first step is to bring up the Envoy dataplane. Envoy will listen on port 1999 and forward all the requests to Postgres server. The default Postgres port is 5432 and Envoy can definitely be configured to listen on port 5432, but to stress the fact that Envoy is actively forwarding the packets, it is configured on a different port than default Postgres port 5432.
The following lines create a listener on port 1999 and bind it to all interfaces:
- name: postgres_listener
  address:
    socket_address:
      address: 0.0.0.0
      port_value: 1999
Next, a filter chain must be attached to the listener. The filter chain describes what happens after a packet is received on the listening port. In this case it consists of PostgresProxy and TcpProxy. PostgresProxy is a filter that will inspect messages exchanged between the Postgres server and client. The last filter in the chain, TcpProxy, is a so-called terminal filter, which provides transport to the upstream hosts, in this case, the Postgres server.
filter_chains:
- filters:
  - name: envoy.filters.network.postgres_proxy
    typed_config:
      "@type": type.googleapis.com/envoy.extensions.filters.network.postgres_proxy.v3alpha.PostgresProxy
      stat_prefix: egress_postgres
  - name: envoy.filters.network.tcp_proxy
    typed_config:
      "@type": type.googleapis.com/envoy.extensions.filters.network.tcp_proxy.v3.TcpProxy
      stat_prefix: postgres_tcp
      cluster: postgres_cluster
The TcpProxy filter’s configuration indicates that requests will be routed to postgres_cluster. Which is defined as following:
- name: postgres_cluster
  connect_timeout: 1s
  type: strict_dns
  load_assignment:
    cluster_name: postgres_cluster
    endpoints:
    - lb_endpoints:
      - endpoint:
          address:
            socket_address:
              address: postgres
              port_value: 5432
The cluster contains a list of endpoints identified as postgres and Envoy will use DNS to find out the IP address of the endpoints. DNS mechanisms may be provided by various means. It may be a standalone DNS server or part of the infrastructure as in Kubernetes. In this example, Docker Compose networking provides DNS resolution.
Gathering Statistics
In this example, statistics are collected by Prometheus. Envoy is capable of exporting statistics directly in Prometheus format. All that needs to be done is to point Prometheus to Envoy. Here is the Prometheus config file:
global:
  scrape_interval:  15s
scrape_configs:
  - job_name: 'envoy_stats'
    scrape_interval: 5s
    metrics_path: /stats/prometheus
    static_configs:
      - targets: ['proxy:8001']
        labels:
          group: 'services'
…where proxy is Envoy’s DNS name and will be resolved by Docker Compose networking. Envoy’s administration interface is exposed on port 8001 under /stats/prometheus path.
Observability
Grafana will be used for graphical representation of Postgres types. All required data is gathered and stored in Prometheus; Grafana periodically reads that data. Two sets of configuration are required by Grafana. The first is data sources:
datasources:
  - name: prometheus
    type: prometheus
    access: proxy
    url: https://prometheus:9090
The important lines are type and url. The type defines the format of the data. The url points to an endpoint where data is available. prometheus is a DNS name that must be resolved to an IP address. In this example, Docker Compose networking will provide address resolution.
The second Grafana configuration item is dashboard spec. It basically defines which data sets will be displayed and how. This is a lengthy json file that is created by Grafana after manual construction of a dashboard. In our example, we’ll track 3 Postgres messages: all frontrend messages (messages generated by a client and going to the server), errors returned by the server and number of SELECT statements issued by a client.
"targets": [
  {
    "expr": "rate(envoy_postgres_egress_postgres_messages_frontend[1m])",
    "interval": "",
    "legendFormat": "frontend msgs",
    "refId": "A"
  },
  {
    "expr": "rate(envoy_postgres_egress_postgres_errors[1m])",
    "interval": "",
    "legendFormat": "errors",
    "refId": "B"
  },
  {
    "expr": "rate(envoy_postgres_egress_postgres_statements_select[1m])",
    "interval": "",
    "legendFormat": "select statements",
    "refId": "C"
  }
],
Generating Traffic
The last piece in this demonstration is generating the Postgres traffic. There are several scripts that run repeatedly and generate various Postgres transactions. The scripts are located in the scripts directory. The scripts run in a loop. During each pass a random number is generated and its value indicates how many times the sequence of transactions is repeated. This gives a feeling of semi-randomness.
Bringing Up the System
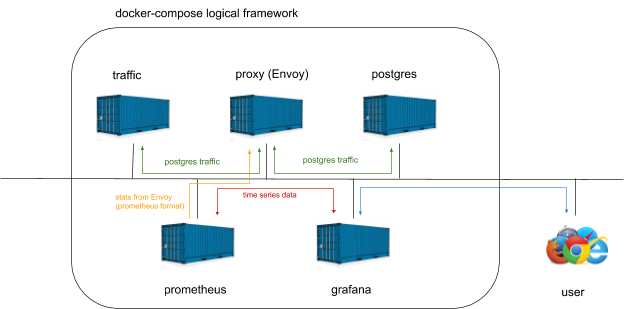
All individual pieces used in this example are brought up as containers. They are “glued” using Docker Compose. The docker-compose file can be downloaded using this link https://github.com/tetratelabs/envoy-postgres-stats-example. The file basically lists all the services along with basic networking configuration and initial data. To bring entire system up just type
docker-compose upin envoy-postgres-stats-example directory. Components involved in this example will be brought up as containers. They communicate using loopback interface and as it was mentioned above components find themselves by a name specified in the docker-compose file. The following picture is a conceptual view of the system brought up by docker-compose.


Exercise
To start the exercise, download all the files from the link https://github.com/tetratelabs/envoy-postgres-stats-example. It is assumed that Docker has been installed on the system. To bring the ecosystem up just type:
docker-compose upGrafana UI is exposed on port 3000. Point your web browser to the instance where docker-compose has been invoked. If the system is run locally type https://localhost:3000. If it runs in the cloud, specify an IP address (make sure that firewall rules allow traffic to TCP port 3000). The default login to Grafana is admin/admin.
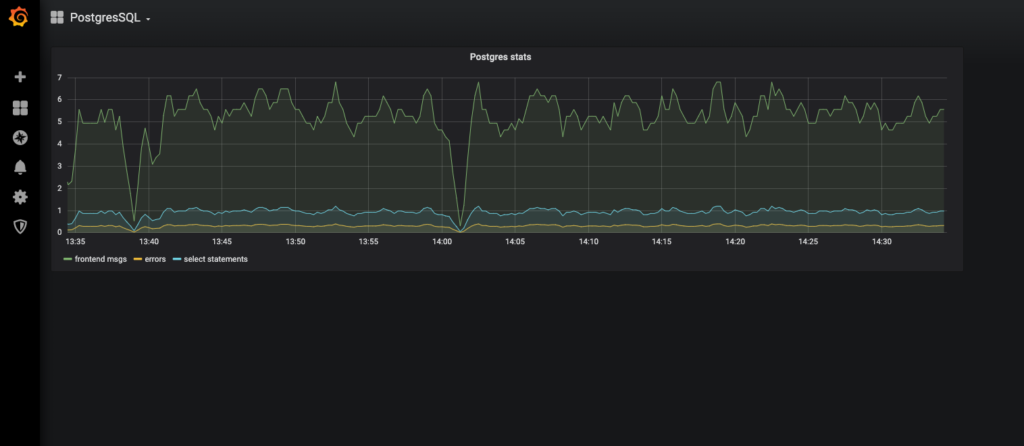
After logging in to Grafana select PostgreSQL dashboard. The example dashboard below contains 3 queries:
- Number of frontend messages (messages generated by scripts generating traffic)
- Number of times the Postgres server replied with error
- Number of SELECT statements


