Istio component ports and functions in detail
In my last blog, I gave you a detailed overview of the traffic in the Istio data plane, but the data plane does not exist in isolation. This article w

In my last blog, I gave you a detailed overview of the traffic in the Istio data plane, but the data plane does not exist in isolation. This article will show you the ports and their usages for each component of both the control plane and data plane in Istio, which will help you understand the relationship between these flows and troubleshoot them.
![]()
Tetrate offers an enterprise-ready, 100% upstream distribution of Istio, Tetrate Istio Subscription (TIS). TIS is the easiest way to get started with Istio for production use cases. TIS+, a hosted Day 2 operations solution for Istio, adds a global service registry, unified Istio metrics dashboard, and self-service troubleshooting.
Overview
Firstly, I will show you a global schematic. The following figure shows the components of a sidecar in the Istio data plane and the objects that interact with it.

Istio components
We can use the nsenter command to enter the namespace of the productpage Pod of the Bookinfo example and see the information about the ports it is listening on internally.
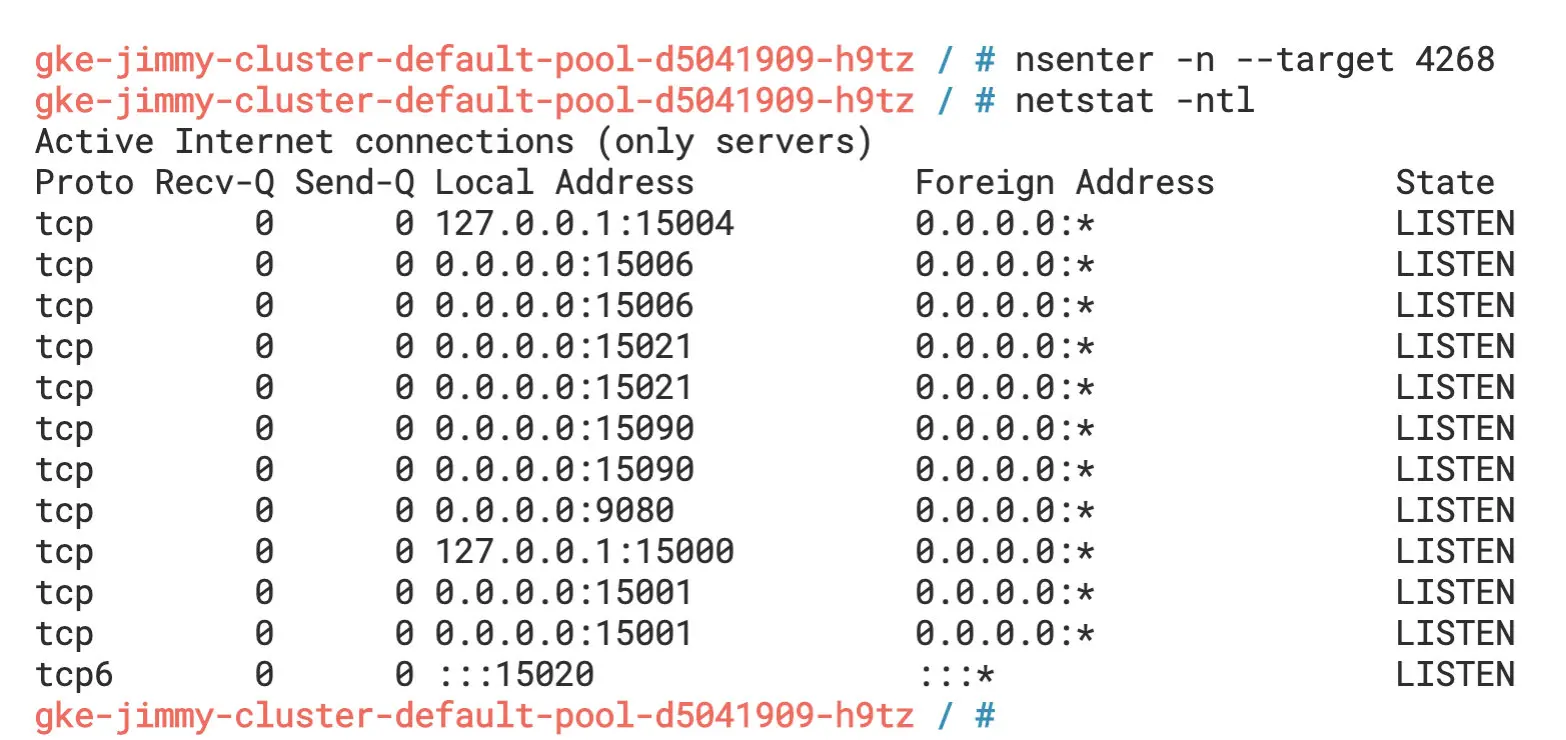
Listening ports
From the diagram, we can see that besides the port 9080 that the productpage application listens to, the Sidecar container also listens to a large number of other ports, such as 15000, 15001, 15004, 15006, 15021, 15090, etc. You can learn about the ports used in Istio in the Istio documentation.
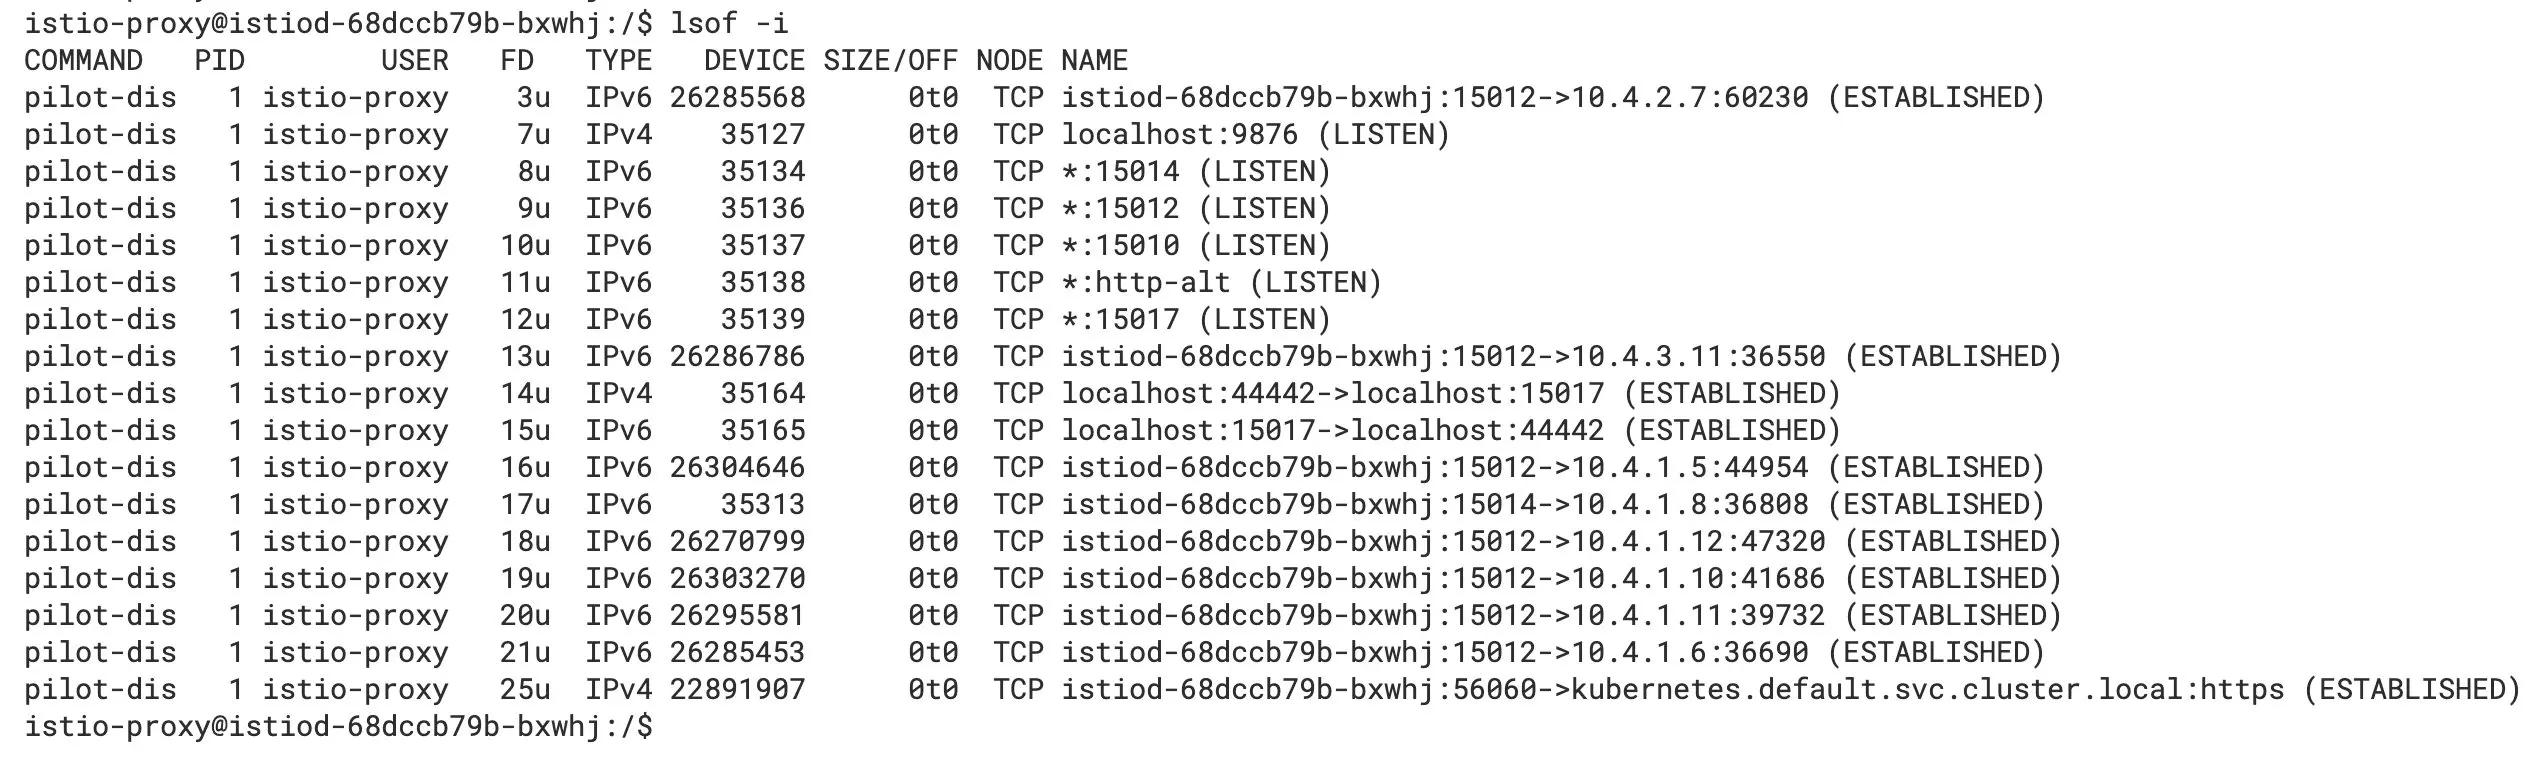
Let’s go back into the productpage Pod and use the lsof -i command to see the ports it has open, as shown in the following figure.
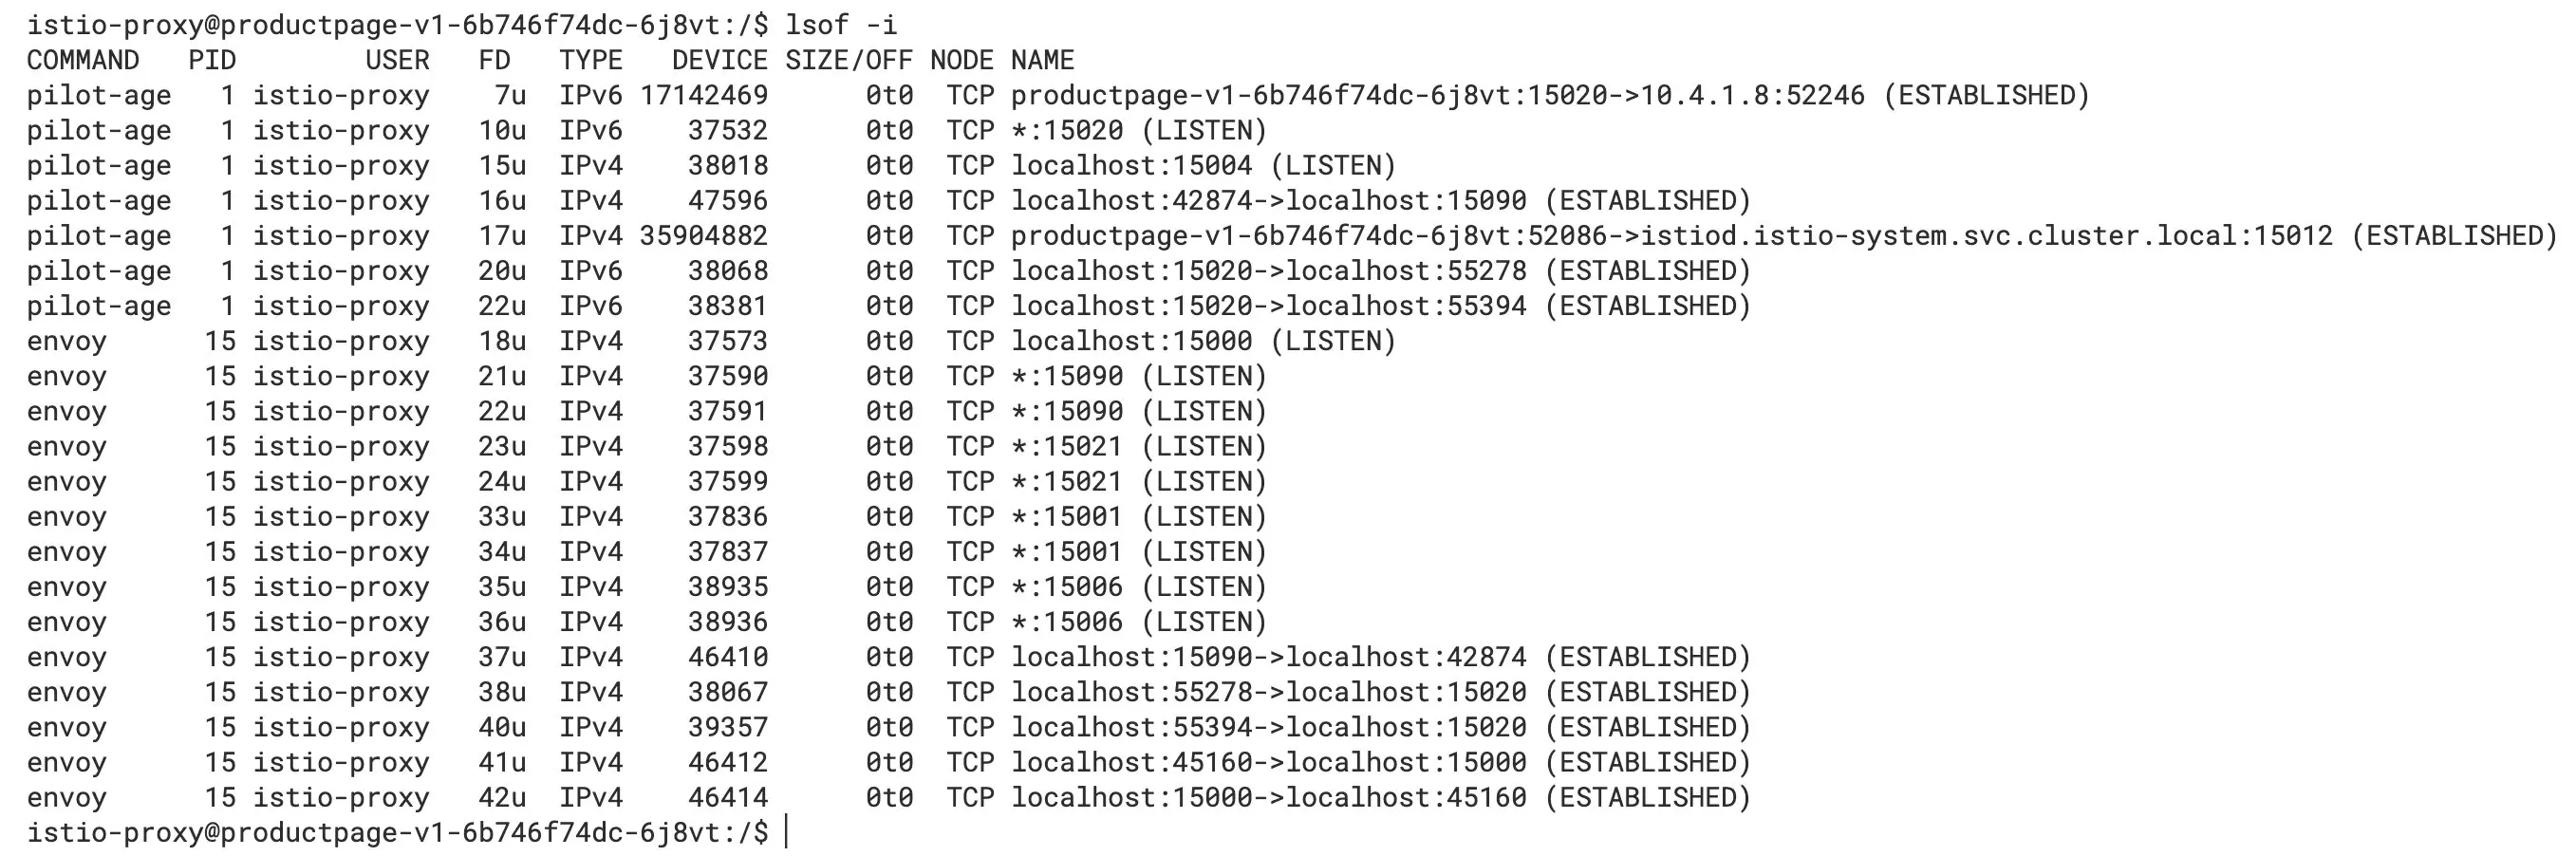
Ports in productpage pod
We can see that there is a TCP connection established between the pilot-agent and istiod, the port in the listening described above, and the TCP connection established inside the Pod, which corresponds to the figure at the beginning of the article.
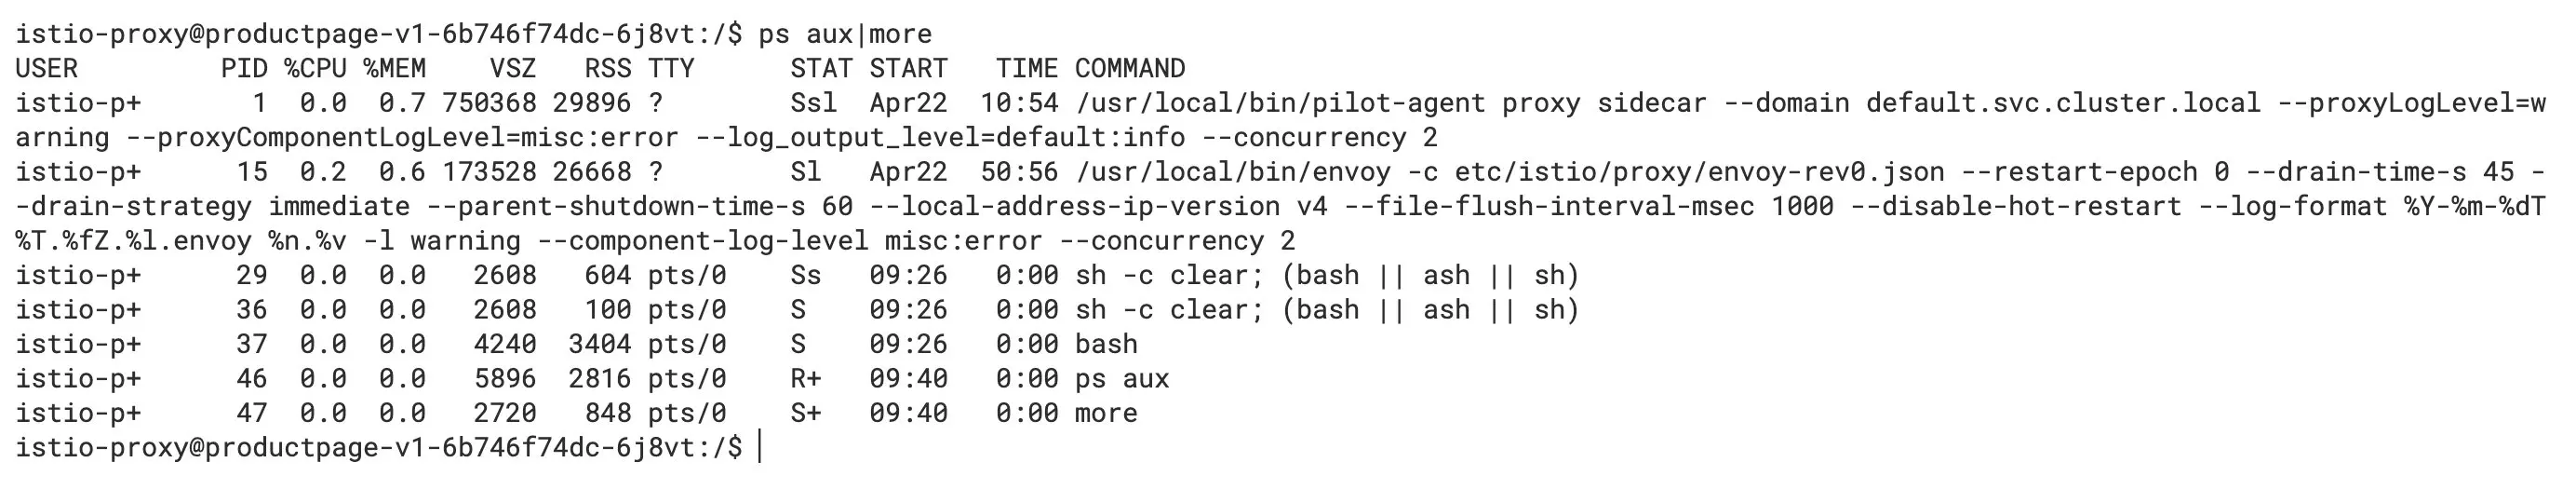
The root process of the Sidecar container (istio-proxy) is pilot-agent, and the startup command is shown below.
Internal processes in productpage pod
As we can see from the diagram, the PID of its pilot-agent process is 1, and it forked the Envoy process.
Check the ports it opens in Istiod, as shown in the figure below.
Istiod ports
We can see the ports that are listened to, the inter-process, and remote communication connections.
Ports usage overview
These ports can play a pivotal role when you are troubleshooting. They are described below according to the component and function in which the port is located.
Ports in Istiod
The ports in Istiod are relatively few and single-function.
- 9876: ControlZ user interface, exposing information about Istiod’s processes
- 8080: Istiod debugging port, through which the configuration and status information of the grid can be queried
- 15010: Exposes the xDS API and issues plain text certificates
- 15012: Same functionality as port 15010, but uses TLS communication
- 15014: Exposes control plane metrics to Prometheus
- 15017: Sidecar injection and configuration validation port
Ports in sidecar
From the above, we see that there are numerous ports in the sidecar.
- 15000: Envoy admin interface, which you can use to query and modify the configuration of Envoy Proxy. Please refer to Envoy documentation for details.
- 15001: Used to handle outbound traffic.
- 15004: Debug port (explained further below).
- 15006: Used to handle inbound traffic.
- 15020: Summarizes statistics, performs health checks on Envoy and DNS agents, and debugs pilot-agent processes, as explained in detail below.
- 15021: Used for sidecar health checks to determine if the injected Pod is ready to receive traffic. We set up the readiness probe on the /healthz/ready path on this port, and Istio hands off the sidecar readiness checks to kubelet.
- 15053: Local DNS proxy for scenarios where the cluster’s internal domain names are not resolved by Kubernetes DNS.
- 15090: Envoy Prometheus query port, through which the pilot-agent will scratch metrics.
The above ports can be divided into the following categories.
- Responsible for inter-process communication, such as 15001, 15006, 15053
- Health check and information statistics, e.g. 150021, 15090
- Debugging: 15000, 15004
Let’s look at the key ports in detail.
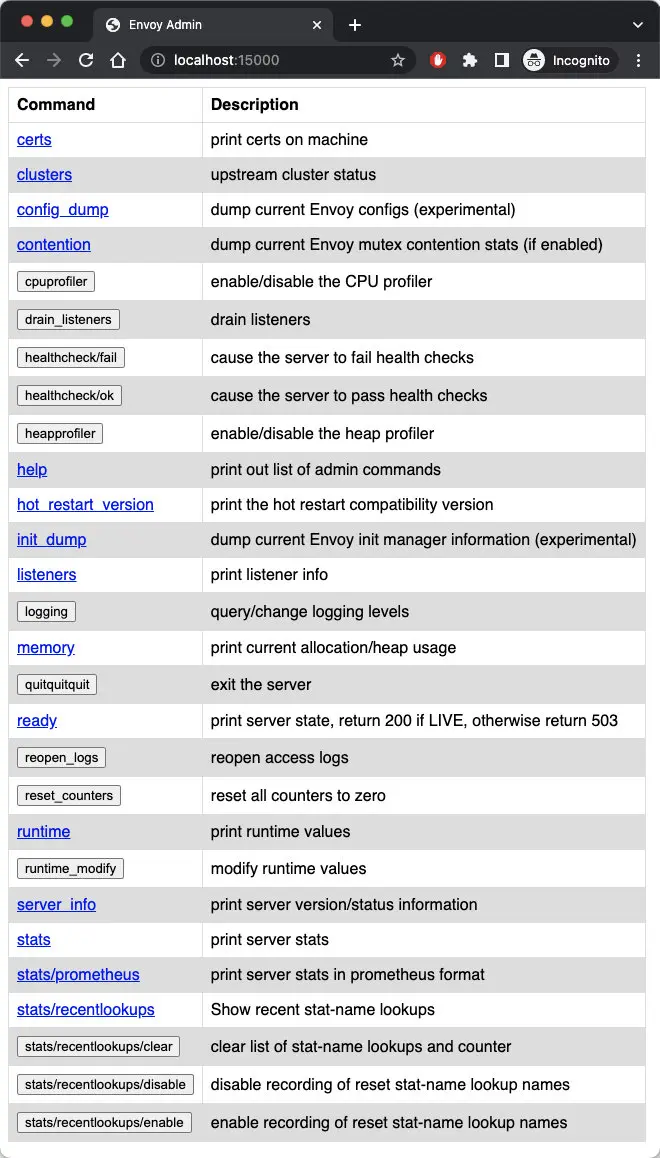
15000
15000 is Envoy’s Admin interface, which allows us to modify Envoy and get a view and query metrics and configurations.
The Admin interface consists of a REST API with multiple endpoints and a simple user interface. You can enable the Envoy Admin interface view in the productpage Pod using the following command:
kubectl -n default port-forward deploy/productpage-v1 15000
Visit https://localhost:15000 in your browser and you will see the Envoy Admin interface as shown below.
15004
With the pilot-agent proxy istiod debug endpoint on port 8080, you can access localhost’s port 15004 in the data plane Pod to query the grid information, which has the same effect as port 8080 below.
Envoy admin interface
8080
You can also forward istiod port 8080 locally by running the following command:
kubectl -n istio-system port-forward deploy/istiod 8080
Visit https://localhost:8080/debug in your browser and you will see the debug endpoint as shown in the figure below.
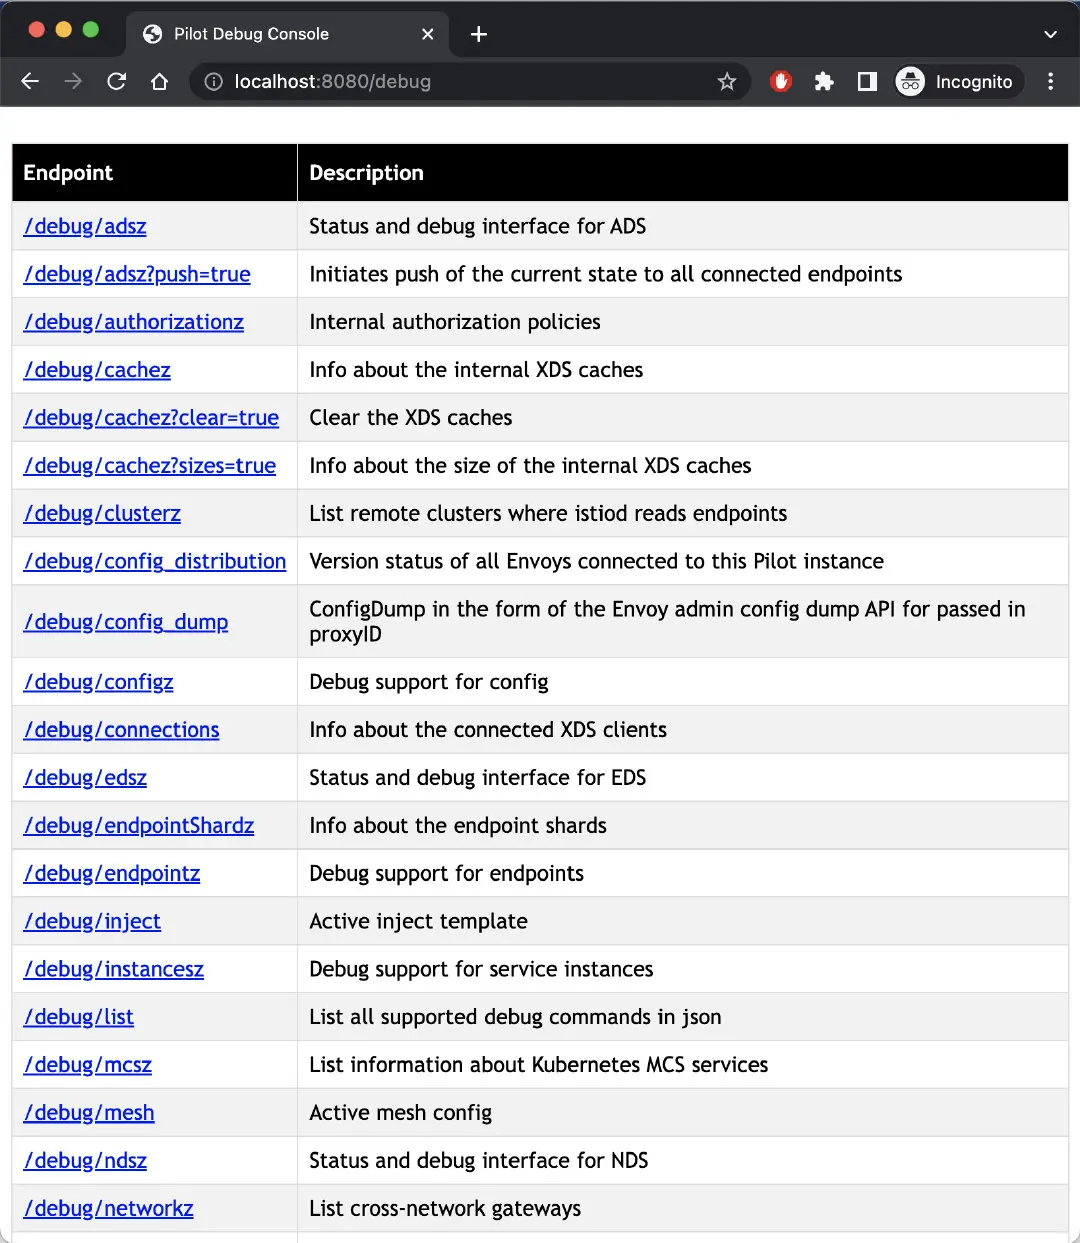
Pilot debug console
Of course, this is only one way to get the mesh information and debug the mesh. You can also use the istioctl command or Kiali to debug it, which will be more efficient and intuitive.
15020
Port 15020 has three main usages.
- Aggregating metrics: You can query port 15090 for Envoy’s metrics, or you can configure it to query the application’s metrics, aggregating Envoy, application, and its own metrics for Prometheus to collect. The corresponding debug endpoint is /stats/prometheus.
- Performing health checks on Envoy and DNS agent: the corresponding debug endpoints are /healthz/ready and /app-health.
- Debugging pilot-agent processes: the corresponding debug endpoints are /quitquitquit, debug/ndsz and /debug/pprof.
The following figure shows the debugging information you see when you open https://localhost:15020/debug/pprof in your browser.
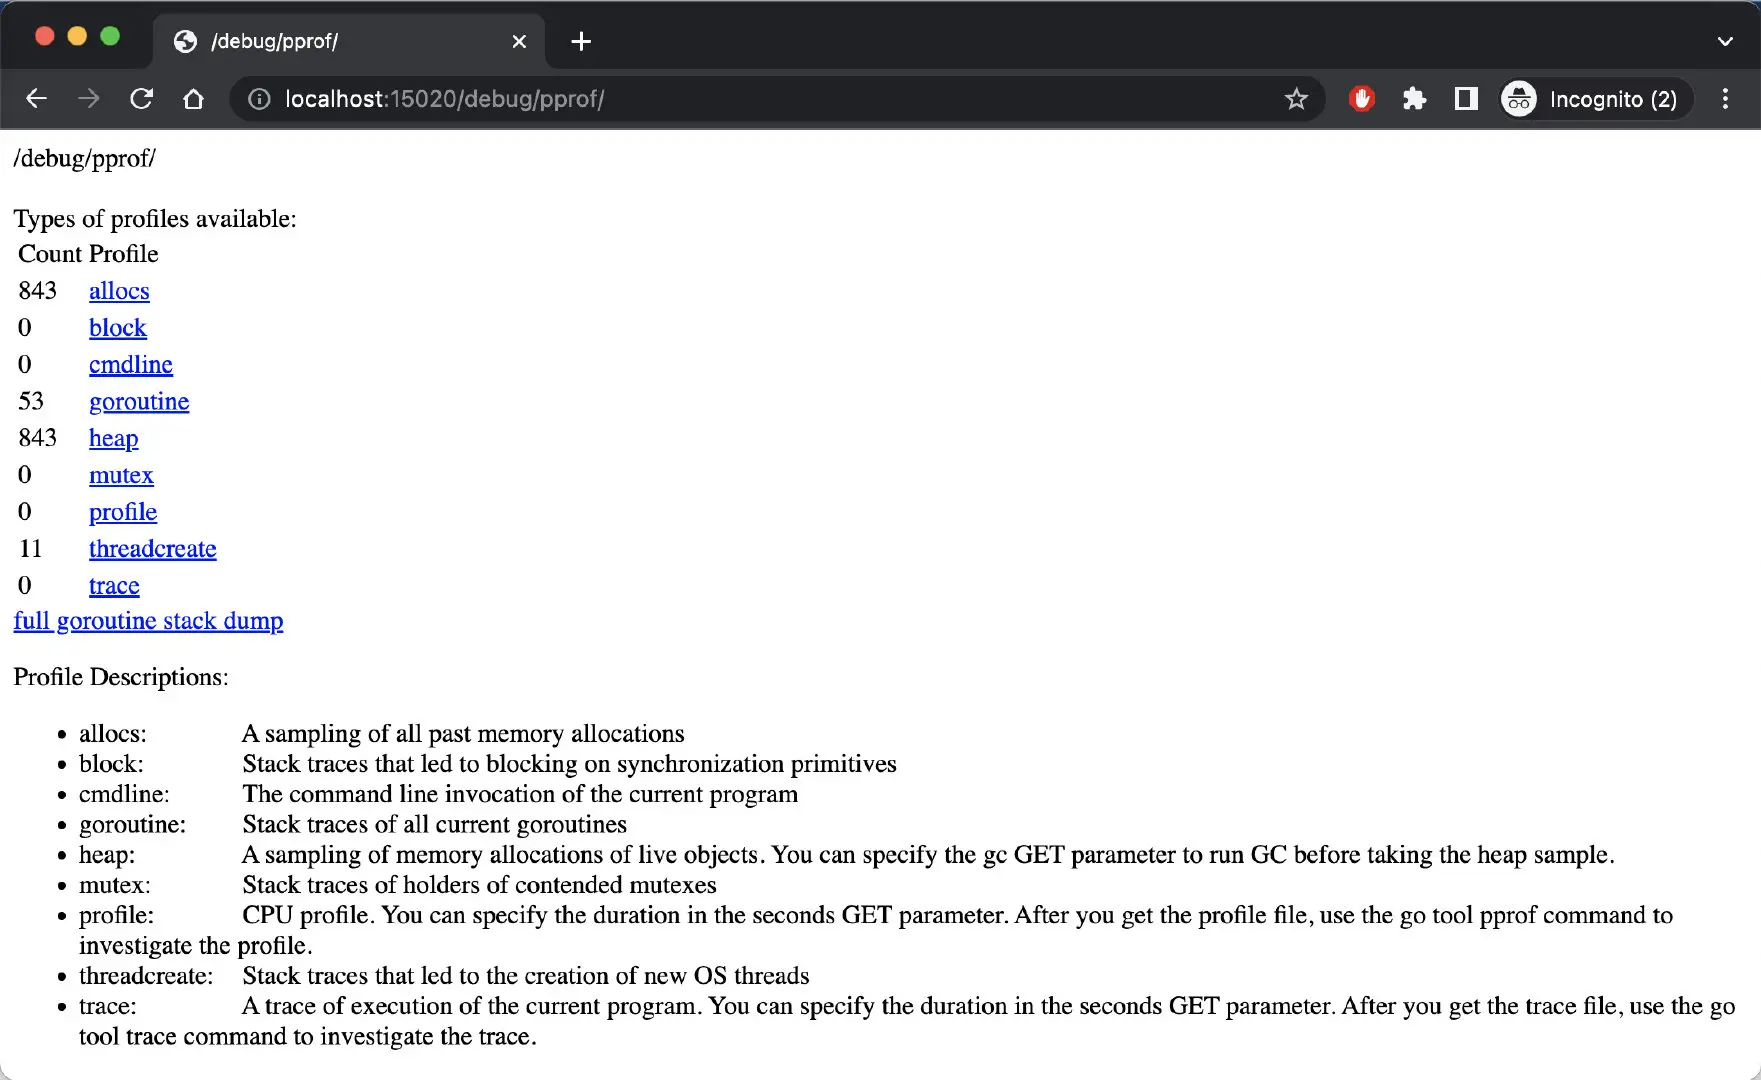
pprof endpoint
The information in the figure shows the stack information of the pilot-agent.
Summary
By understanding the component ports in Istio, you should have a better understanding of the relationship between the components in Istio and their internal traffic. Being familiar with the functions of these ports will help in troubleshooting the mesh.