Key Metrics to Monitor the Istio Data Plane
The Istio Service Mesh Data Plane is ubiquitous in a Kubernetes cluster. The term refers to Envoy Proxies components in two different roles, sidecars

The Istio Service Mesh Data Plane is ubiquitous in a Kubernetes cluster. The term refers to Envoy Proxies components in two different roles, sidecars and gateways. Those are in charge of proxying traffic, enforcing policies, mTLS operations and generating a ton of metrics. If the Control Plane is the brain, the Data Plane is the actual hand on the wire.
For newly acquainted users to the mesh, the deep observability features this Data Plane provides effortlessly is a lovely surprise, but it can also bring a swamp around the many possible dimensions each metric can present. This blog post focuses on observing the Ingress Gateways, but the same recommendations can be also applied to the sidecars.
If you are interested in learning the key metrics to monitoring the Istio Control Plane, this blog post will come in handy ›
Tetrate offers an enterprise-ready, 100% upstream distribution of Istio, Tetrate Istio Subscription (TIS). TIS is the easiest way to get started with Istio for production use cases. TIS+, a hosted Day 2 operations solution for Istio, adds a global service registry, unified Istio metrics dashboard, and self-service troubleshooting.
Observability Kickstart
Even though there are quite a few observability solutions out in the wild, the Istio project has a good starting point in its downloadable bundle with a prometheus.yaml containing the prometheus machinery plus a configmap with the necessary configs for it to scrape and polish some of the metrics with Kubernetes data.
$ pwd
/home/downloads/istio-1.23.2/samples/addons
$ ls
extras  grafana.yaml  jaeger.yaml  kiali.yaml  loki.yaml  prometheus.yaml  README.md
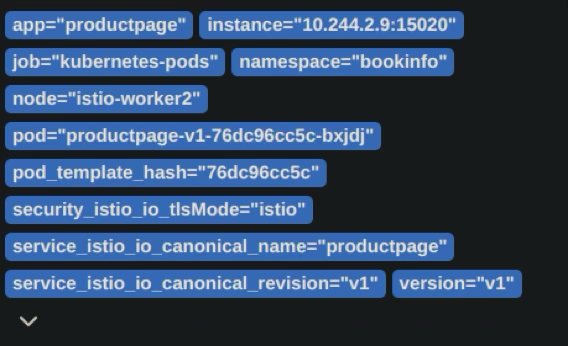
This config creates the following dimensions to filter and observe traffic:

And for an ingress gateway:
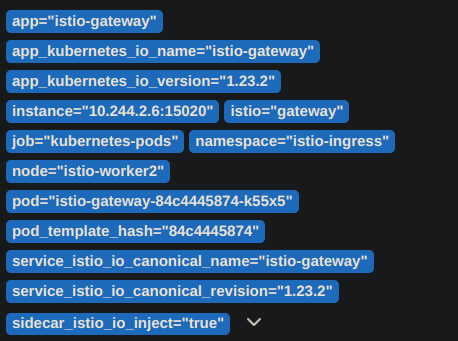

The shown dimensions can be tweaked to include or exclude information. For example, a few weeks ago, one of our customers reached out to us requiring guidance on how to add specific dimensions to observe not only the source and destination namespaces of their requests, but also the Cloud Platform Region and Availability Zone for each request. This helped them to better understand their traffic patterns and to identify cost-saving opportunities.
What to observe: Istio Golden Metrics
As well as with the Control Plane, the observability framework proposed is the Golden Metrics: latency, traffic, errors, and saturation. These provide a great overview of your distributed system.
The Istio Data Plane creates service-to-service monitoring data from two perspectives or reporters: source and destination. This is due to both the Envoys involved in the requests reporting data from their particular perspective. And you can decide what side to look for.
Latency Metrics
Latency measures every request’s response time and it is delivered in the key metric istio_request_duration_milliseconds_bucket. As it is a bucket, you have access to focus on different parts of the distribution of latencies for the same service by using a le label it comes with.
This metric has allowed our customers to filter how different app versions behave at the 99% slower responses. By identifying a new app version is slightly slower than the previous one on the slowest requests, even though the average request was faster, the platform team could feedback the app devs on this issue.
Traffic Metrics
This measures how many requests clients are sending to your service. A key metric to measure it is istio_requests_total . It is a counter increasing with every single request reported, and calculating its increase rate provides the number of requests per second to any service or gateway in the mesh.
This metric reported by a Gateway effectively lets you know the external traffic coming into the mesh from that entry point.
Error Metrics
The errors reported by the data plane metrics have at least two different reasons: whether the client or app are doing something wrong, like a bad request or a timeout, or the configs present in the Gateway are not properly set, for example a port mismatch to its backend.It is also istio_requests_total the metric reporting errors, as one of its dimensions, response_code, accounts for the http response code. In the below example, if there were any 503 errors, a second metric would be tracing this specific parameter.


Our customers have set alerting based on the response codes and it is very common for us to hear from them looking for help about what might be wrong. The collaboration with Tetrate’s expertise accelerates the debugging process and brings about proposals to harden the mesh.
Saturation Metrics
Istio version 1.23 has a default resource allocation for the data plane like this:
resources:
          limits:
            cpu: "2"
            memory: 1Gi
          requests:
            cpu: 100m
            memory: 128Mi
To follow the actual resources usage, container_cpu_usage_seconds_total and container_memory_working_set_bytes come in handy.
Parting Thoughts
At Tetrate we’ve identified the importance of observing the Data Plane and understanding what is being observed, as this empowers the platform and devops teams to think hard based on evidence and documented patterns in their system. We regularly partner with our customers to be a second pair of eyes in interpreting and contextualizing some observations that are not common in their day to day, or in scenarios where team rotations are recent.


