Get%20started%20with%20Envoy%20Proxy%20in%205%20minutes
Envoy is the engine that keeps Istio running

Envoy is the engine that keeps Istio running. If you’re familiar with Istio, you know that the collection of all Envoys in the Istio service mesh is also referred to as the data plane.
In this blog post, we’ll look at the fundamentals of Envoy: the building blocks of the proxy and, at a high level, how the proxy works. Understanding this will help you better understand how Istio works.
![]()
Tetrate offers an enterprise-ready, 100% upstream distribution of Envoy Gateway, Tetrate Enterprise Gateway for Envoy (TEG). TEG is the easiest way to get started with Envoy for production use cases.
What is Envoy proxy?
Envoy Proxy is an open-source edge and service proxy designed for cloud-native applications. The proxy was originally built at Lyft. It’s written in C++ and designed for services and applications, and it serves as a universal data plane for large-scale microservice service mesh architectures.
The idea is to have Envoy sidecars run next to each service in your application, abstracting the network and providing features like load balancing, resiliency features such as timeouts and retries, observability and metrics, and so on.
One of the cool features of Envoy is that we can configure it through network APIs without restarting! These APIs are called discovery services or xDS for short.
In addition to the traditional load balancing between different instances, Envoy also allows you to implement retries, circuit breakers, rate limiting, and so on.
Also, while doing all that, Envoy collects rich metrics about the traffic it passes through and exposes the metrics for consumption and use in tools such as Grafana, for example.
What are Envoy’s building blocks?
Let’s explain Envoy’s building blocks using an example. Let’s say we have the Envoy proxy running, and it’s sending requests through to a couple of services. We are trying to send a request to the proxy, so it ends up on one of the backend services.
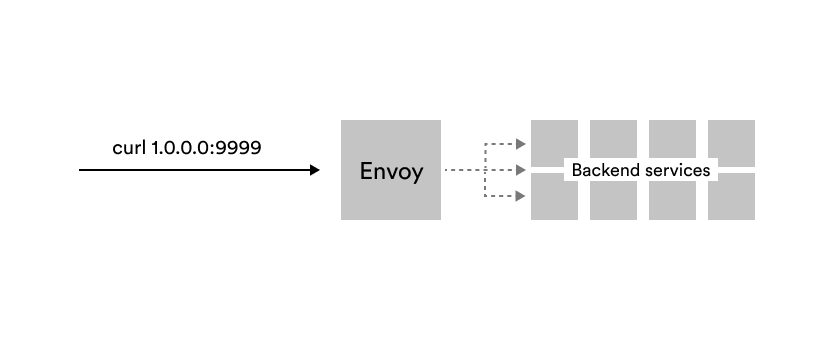
To send a request, we need an IP address and a port the proxy is listening on (e.g., 1.0.0.0:9999 from the image above).
The address and port Envoy proxy listens on is called a listener. Listeners are the way Envoy receives connections or requests. There can be more than one listener as Envoy can listen on more than one IP and port combination.
Attached to these listeners are routes – routes are a set of rules that map virtual hosts to clusters. We could look at the request metadata– things like headers and URI path — and then route the traffic to clusters.
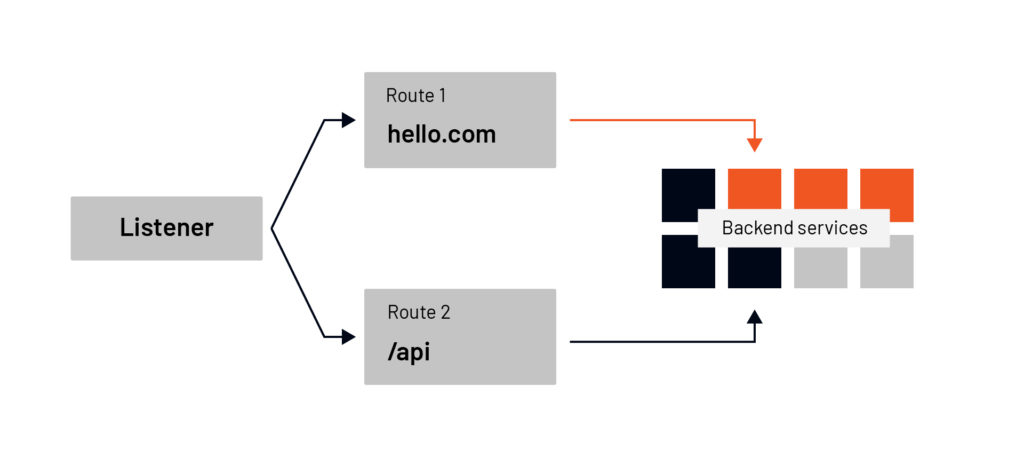
For example, if the Host header contains the value hello.com, we want to route the traffic to one service, or if the path starts with /api we wish to route to the API back-end services. Based on the matching rules in the route, Envoy selects a cluster.
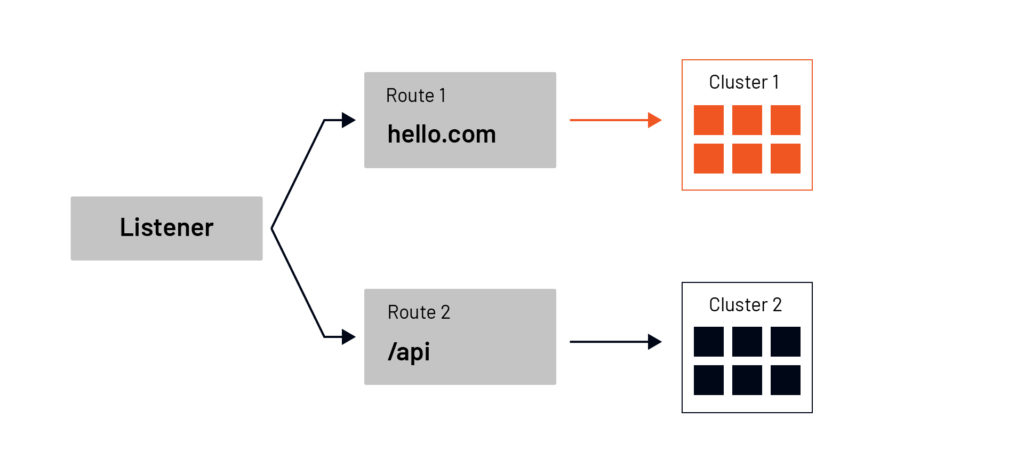
Clusters
A cluster is a group of similar upstream hosts that accept traffic. We could have a cluster representing our API services or a cluster representing a specific version of back-end services. This is all configurable, and we can decide which hosts to include in which clusters. Clusters are also where we can configure things like outlier detection, circuit breakers, connection timeouts, and load balancing policies.
Once we have received the request, we know where to route it (using the routes) and how to send it (using the cluster and load balancing policies). We can select an endpoint to send the traffic to. This is where we go from a logical entity of a cluster to a physical IP and port. We can structure the endpoints to prioritize certain instances over other instances based on the metadata. For example, we could set up the locality of endpoints to keep the traffic local, to send it to the closest endpoint.
What are Envoy proxy filters?
When a request hits one of the listeners in Envoy, that request goes through a set of filters. There are three types of filters that Envoy currently provides, and they form a hierarchical filter chain:
**1. Listener filters **Listener filters access raw data and can manipulate metadata of L4 connections during the initial connection phase. For example, a TLS inspector filter can identify whether the connection is TLS encrypted and extract relevant TLS information from it.
2. Network filters Network filters work with raw data as well: the TCP packages. An example of a network filter is the TCP proxy filter that routes client connection data to upstream hosts and generates connection statistics.
3. HTTP filtersHTTP filters operate at layer 7 and work with HTTP data. The last network filter in the chain, HCM or HTTP connection manager filter, optionally creates these filters. The HCM filter translates from raw data to HTTP data, and the HTTP filters can manipulate HTTP requests and responses.
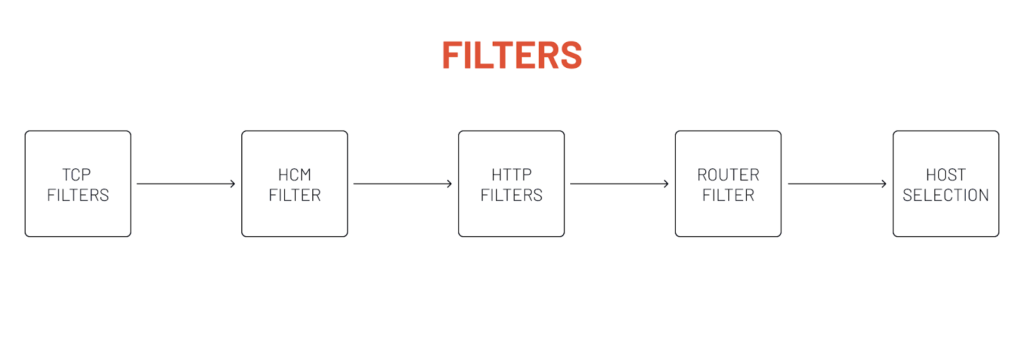
Listeners have a set of TCP filters that can interact with the TCP data. There can be more than one TCP filter in the chain, and the last filter in the chain is a special one called the HTTP connection manager (HCM). The HCM filter turns Envoy into an L7 proxy; it converts the bytes from the requests into an HTTP request.
Within the HTTP connection manager filter, another set of HTTP filters can work with the HTTP requests. This is where we can do things on the HTTP level– we can work with headers, interact with the HTTP body, etc. Within the HTTP filter is where we define the routes, and the cluster selection happens.
The last filter in the HTTP filter chain is called a router filter. The router filter sends the requests to the selected cluster.
What are HTTP filters?
We can think of HTTP filters as pieces of code that can interact with requests and responses. Envoy ships with numerous HTTP filters, but we can also write our filters and have Envoy dynamically load and run them.
The HTTP filters are chained together, so we can control where the filter gets placed in the chain. The fact that filters are chained means that they need to decide whether to continue executing the next filter or stop running the chain and close the connection.
There’s no need to have the filters compiled together with the Envoy proxy; we could do that, but it’s impractical.
By default, the filters are written in C++. However, there’s a way to write the filters in Lua script, or we can use WebAssembly (Wasm) to develop them in other languages.
Envoy proxy and dynamic configuration
A significant feature of Envoy is the ability to use dynamic configuration. So instead of hardcoding information about the clusters or endpoints, we could implement a gRPC or REST service that dynamically provides information about the clusters and endpoints.
Then in the Envoy configuration, we can reference these gRPC/REST endpoints instead of explicitly providing the configuration for clusters or endpoints.
Istio’s pilot uses the dynamic configuration to discover the services in Kubernetes. For example, it reads the Kubernetes services and Endpoints, gets the IP addresses and ports, converts the data into Envoy readable configuration, and sends it to the Envoy proxies– the data plane– through these discovery services. Effectively, this allows us to create our control plane and integrate it with Envoy.
Envoy proxy example in 5 minutes
We’ll start with two Docker containers that run a simple NodeJS application. One container is listening on port 5050, and the other one is listening on port 5000. The color-app source is available on Github.
docker run -dit --env BG_COLOR="blue" -p 5050:3000 gcr.io/tetratelabs/color-app:1.0.0
docker run -dit --env BG_COLOR="green" -p 5000:3000 gcr.io/tetratelabs/color-app:1.0.0
In this example, we’ll create an Envoy configuration that routes all traffic sent to /blue to the blue container and traffic sent to /green to the green container. We’ll have a single listener, and then based on the URI, we’ll route traffic to or the other container.
Using func-e CLI to install Envoy proxy
Before we start writing the configuration, let’s install a CLI called func-e. We can use this CLI to manage and run different Envoy versions:
curl -L https://func-e.io/install.sh | bash -s -- -b .Let’s start with a minimal configuration that doesn’t do much:
Save the above YAML to config.yaml. If we run Envoy with this configuration, the proxy will start, and it will listen on port 10000. However, we haven’t defined any filter chains, routes, or clusters, so it’s not going to know what to do with the request:
func-e run -c config.yamlIf we send the request, Envoy will close the connection.
Adding the HTTP connection manager
Let’s update this config and add the HTTP filter and the router filter to the HTTP filter chain, but without any configuration:
We are adding a single filter – the HTTP connection manager, and then inside that filter, we add the router filter. Remember, that’s the last filter in the chain that does the routing. Note that this config doesn’t have any routes defined, so if we run this, it works, but we’ll get back a 404.
Let’s create a straightforward route config that returns a direct response so that we see what the configuration looks like:
With this configuration, we’re defining a single virtual host that matches all domains. Once it matches the domain, it will try to match the prefix. Once it matches the prefix as well, it returns a direct response.
Let’s run Envoy with this configuration and send a request to localhost:10000:
_$ func-e run -c config.yaml &_
_..._
_$ curl localhost:10000_
The response should be an HTTP 200 and Hello. You’ll also notice Envoy set the server response header (server: envoy).
Routing requests to a cluster
Sending a direct response is not too helpful. Let’s change that, and instead of a direct_response, use a route that will select a cluster.
With this change, we create a single virtual host that matches all domains, and then within the routes, we are checking for the prefix match. The first match checks for /blue, and within the route, we’re specifying the cluster name. The same goes for the /green path and the green cluster.
We also need to define the two clusters:
Let’s re-run the Envoy (func-e run -c config.yaml). Now, if we open localhost:10000/blue we’ll get the response from the blue container, and if we open localhost:10000/green we’ll get the response from the green container.
Conclusion
This blog post gave you a quick, 5-minute overview of Envoy proxy. We explained what the basic building blocks of Envoy are – listeners, routes, clusters, and endpoints – and showed how one connects to another. Finally, we’ve used an example that shows how to create a basic Envoy configuration that makes routing decisions based on the URI paths and routes the traffic to backing clusters.
Here are a few references and resources you can use to continue learning about Envoy:
- Envoy proxy documentation
- Func-e CLI
- Envoy fundamentals (Istio weekly)
- Envoy 101: Configuring Envoy as a Gateway
- Envoy Deep Dive (by Lizan Zhou)
- Lyft’s Envoy: Embracing a service mesh (by Matt Klein)
- Making Envoy Contributions Feasible for Everyone (by Yaroslav Skopets)
- Envoy & Service Mesh for Databases: what the Future Holds (by Christoph Pakulski and Prasad Radhakrishnan