Smart Routing Benchmark: 61% Lower Agent Cost, Same Pass Rate
A cheaper model is only a bargain if it finishes the job. In our largest matched comparison, lower reasoning effort on the same model cut estimated cost per success 61% with no drop in pass rate.
 Nick DiZazzo
We wrapped up the analysis on November 14, 2026. To compare costs, we normalized API prices to one date, and applied it to the usage we recorded. Those estimates aren’t actual bills or savings we’ve measured for customers.
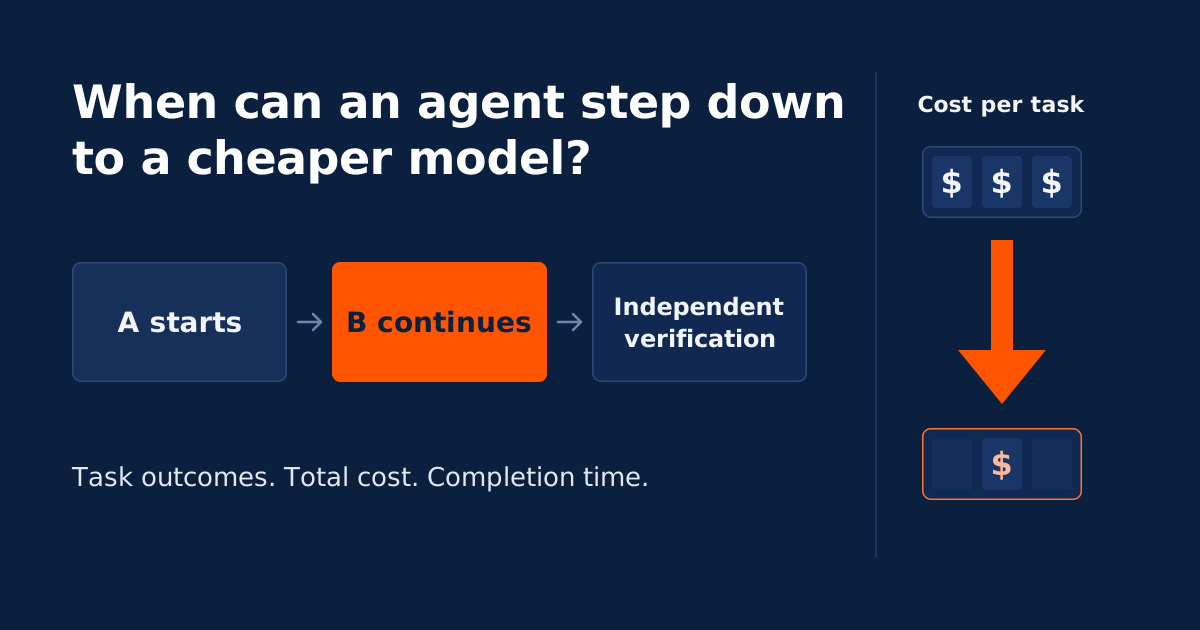
This smart routing benchmark tested whether an agent can step down to a cheaper model after a strong model starts the task. The best lead was a different change: lower reasoning effort on the strong model. Handoffs to a cheaper model gave mixed results.
| Strategy | Result against the strong model alone |
|---|---|
| Low reasoning effort, Claude Opus 5 | 61% lower cost per success ($0.297 vs. $0.770). Same pass rate: 44 of 64. |
| Low reasoning effort, GPT-5.6 Sol | Fewer tasks passed: 23 of 37 vs. 30 of 37. |
| Claude Sonnet 5 finishes the task (ABB) | 48% lower cost per success, pass rate 71.4% vs. 68.3%. A second group passed 39.4% vs. 66.7%. |
| Claude Opus 5 returns to review (ABA) | 37% higher cost per success. Same pass rate: 40 of 60. |
| Cheaper model alone, GPT-5.6 Luna | 92.5% lower cost per success. Pass rate 62.7% vs. 73.5%. |
| First call back to the strong model | 12.3% of input tokens read from cache. Calls that stay on one model read 95.3%. |
Where to start: test lower reasoning effort before you test a handoff. Treat a fixed handoff as an experiment for one workload. Samples are small. Costs are estimates at API prices, with evidence through November 14, 2026.
A cheaper model looks like an easy saving for an agent. The saving is real only when the agent still finishes the task. A model step-down moves an agent task from a strong model to a cheaper model, or to a lower reasoning effort setting on the same model, to cut cost. That question sits next to smart routing: when can a single call move to a cheaper model without losing the job?
We ran terminal-agent tasks with a strong model (A) and a cheaper model (B). An independent verifier graded every run, so a model’s own claim of completion did not count. We measured cost per success: the total estimated cost of all runs, failed runs included, divided by the number of runs that passed.
In one Claude Opus 5.5 / Claude Sonnet 5.5 comparison, letting Claude Sonnet 5.5 finish made successful work cheaper but left more tasks unfinished. The handoff chart shows that trade-off. Other comparisons were too small or had too much missing cost data to settle the question.
A useful lead came from a simpler control: keep the strong model and lower its reasoning effort. In a November 2026 Tetrate benchmark, Claude Opus 5 at low reasoning effort passed 44 of 64 runs, the same as at high effort, at a 61% lower estimated cost per success. Other conditions lost completions at lower effort, so this is a candidate to test on a workload, not a replacement for checking quality.
Benchmark setup
The workload was Terminal-Bench 2.1 terminal-agent tasks, including merging data sources and optimizing SQL queries. Those tasks are named multi-source-data-merger and query-optimize. An agent could read files, write code, and run tools; each task’s independent verifier judged whether the work passed. A model reporting completion wasn’t enough.
We call the stronger starting model A and the cheaper candidate B. Both handoff rules switched to B after A’s first completed workload model call. In an ABB handoff, the strong model A starts the task and the cheaper model B finishes the task with no return to A. In an ABA handoff, model A starts, model B works, and model A returns for a limited review and repair stage. The switch didn’t depend on task difficulty or the content of the current step. These results apply to those simple rules, not to every possible routing policy.
We also ran A alone, B alone, A at lower configured reasoning effort, and random switching. Those controls matter because a handoff needs to justify its extra complexity against simpler choices.
Method schematic. Dots mean additional calls, not a fixed duration or measured trace. Review budgets and effort settings come from each condition's frozen manifest.
- A-only
- A A… A
A handles the whole task at the pair's standard effort.
- A-LOW
- A low A low… A low
The same A model handles the task at the lowest available effort.
- ABA
- A B… A review
A's first completed workload call, B through reported completion, then bounded A review and repair.
- ABB
- A B… B finish
The same handoff to B, which finishes without returning to A.
- B-only
- B B… B
B handles the whole task.
- RAND
- A or B A or B… A or B
A seeded draw at each workload call, with a declared 0.5 probability of B.
Every arm ends with the task's independent verifier. A's review is not the final grade. Attempts may stop before reaching later phases.
A comparison matches the same task and repeat within compatible settings: task version, agent and tool configuration, model settings, and execution environment, apart from the change being tested. We call such a group a condition. Actual concurrent load wasn’t fully measured. Trials with incompatible settings stay separate, even when the named models are the same.
Cost per success
A cheap attempt isn’t much use if it doesn’t finish the job. Cost per success is the total estimated cost of all runs, failed runs included, divided by the number of runs that passed an independent verifier. We use that measure to ask how much estimated model spend it took to produce work that passed. For a longer primer, see a learning center article on LLM cost.
Cost per success = total estimated cost of included executions, including failures, divided by the number that passed.
This isn’t the average cost of the successful executions alone. Failed work still consumes tokens and budget, so its cost stays in the total. A strategy that makes each attempt cheaper can still cost more per success if too few tasks pass.
For each comparison, we use matching task-and-repeat pairs where both strategies have rated outcomes and complete model-attempt costs. Each strategy’s total cost and pass count come from that same subset. Missing cost isn’t zero, and without any passes we can’t report a cost per success.
The charts compare this measure with A-only on those pairs. Lower cost per success means less estimated spend per verified completion, but it doesn’t guarantee an acceptable pass rate. That’s why we show the pass-rate bars alongside cost and report how much of the comparison has complete cost data.
The headline estimates use each trial’s latest observed execution, including every recorded model attempt within it. Earlier executions replaced by a rerun stay in separate repair-chain accounting, not in the headline cost ratios.
Lower reasoning effort
The chart below shows the largest matched Claude Opus 5 / Claude Sonnet 5 trial group, chosen by coverage rather than by the size of a saving. Reasoning effort is a provider setting that controls how much computation a model spends before the model answers. Here, standard Claude Opus 5 effort was configured as high and lower effort as low.
Each row compares its strategy with A-only on matching task and repeat results. The population changes when an outcome is unrated or the recorded conditions don’t match. These are separate comparisons against A-only, not direct tests between the alternatives.
Claude Opus 5 / Claude Sonnet 5. Each row is a separate matched comparison against standard-effort Claude Opus 5, not a test between alternatives.
How often did the task pass?
Alternative Matched A-only baseline
How much did cost per successful task change?
Left means cheaper. Right means more expensive. Dots are estimates; lines show 95% uncertainty ranges. A line crossing zero leaves both savings and higher cost plausible.
22 distinct tasks per comparison, except ABA with 21. Success uses all rated pairs; cost uses only complete-cost pairs. Equal pass rates don't establish equal quality. Costs use API prices, not invoices. Intervals apply to each comparison individually.
Exact chart data and cost coverage
- A at lower effort. Alternative passes 44/64 (68.8%); matched A-only passes 44/64 (68.8%). Estimated cost per success is 61.0% lower, with a 95% range from 76.0% lower to 43.0% lower. Source ratio 0.39 [0.24, 0.57]. Complete cost for 61/64 pairs (95.3%).
- ABB, B finishes. Alternative passes 45/63 (71.4%); matched A-only passes 43/63 (68.3%). Estimated cost per success is 48.0% lower, with a 95% range from 65.0% lower to 21.0% lower. Source ratio 0.52 [0.35, 0.79]. Complete cost for 59/63 pairs (93.7%).
- B alone. Alternative passes 46/64 (71.9%); matched A-only passes 44/64 (68.8%). Estimated cost per success is 38.0% lower, with a 95% range from 62.0% lower to 1.0% lower. Source ratio 0.62 [0.38, 0.99]. Complete cost for 61/64 pairs (95.3%).
- Random switching. Alternative passes 40/62 (64.5%); matched A-only passes 42/62 (67.7%). Estimated cost per success is 15.0% higher, with a 95% range from 11.0% lower to 44.0% higher. Source ratio 1.15 [0.89, 1.44]. Complete cost for 58/62 pairs (93.5%).
- ABA, A reviews. Alternative passes 40/60 (66.7%); matched A-only passes 40/60 (66.7%). Estimated cost per success is 37.0% higher, with a 95% range from 1.0% higher to 88.0% higher. Source ratio 1.37 [1.01, 1.88]. Complete cost for 56/60 pairs (93.3%).
Strategy chart data
On a small screen, scroll the table sideways. Ratios below 1 mean lower cost per successful task than the matched A-only baseline.
| Strategy | Passes / rated trials | Matched A-only passes / rated trials | Cost per successful task ratio | Complete-cost pairs / rated pairs |
|---|---|---|---|---|
| A at lower effort | 44/64 (68.8%) | 44/64 (68.8%) | 0.39 [0.24, 0.57] | 61/64 (95.3%) |
| ABB, B finishes | 45/63 (71.4%) | 43/63 (68.3%) | 0.52 [0.35, 0.79] | 59/63 (93.7%) |
| B-only | 46/64 (71.9%) | 44/64 (68.8%) | 0.62 [0.38, 0.99] | 61/64 (95.3%) |
| Random switching | 40/62 (64.5%) | 42/62 (67.7%) | 1.15 [0.89, 1.44] | 58/62 (93.5%) |
| ABA, A reviews | 40/60 (66.7%) | 40/60 (66.7%) | 1.37 [1.01, 1.88] | 56/60 (93.3%) |
On the 61 complete-cost pairs, both effort settings passed 43/61 trials (70.5%). Estimated cost per successful task was $0.297 at low effort versus $0.770 at high effort, about 61.5% lower. The chart converts the rounded source ratio of 0.39 to 61% lower. Three of 64 rated pairs (4.7%) lack complete cost.
The lower-effort result is promising, but the matching pass-rate bars don’t establish equal quality. This sample is still too small to rule out a meaningful quality loss.
On the complete-cost subset, estimated cost per successful task is about $0.30 at low effort versus $0.77 at high effort. The strategy chart shows the saving alongside the pass rates. Some pairs lack complete cost, so the saving doesn’t describe the full comparison.
Lower-effort Claude Opus 5 also made fewer model calls. Tasks finished sooner on average, but the evidence for a time saving is less clear. Fewer calls didn’t establish a reliable speedup.
The next chart shows why that result isn’t a general recommendation. In another Claude Opus 5 comparison, lower effort left more tasks unfinished. The effort settings are the same, but the task mix and execution settings differ. The result doesn’t identify which difference matters.
Low effort versus standard effort in four separate trial groups. The two Claude Opus 5 groups differ in task mix and execution settings.
How often did the task pass?
Alternative Matched A-only baseline
How much did cost per successful task change?
Left means cheaper. Right means more expensive. Dots are estimates; lines show 95% uncertainty ranges. A line crossing zero leaves both savings and higher cost plausible.
The cost panel isolates the cited GPT-6 Astra comparison, whose estimate is close to no change. The other cost comparisons aren't plotted here. Groups aren't pooled or ranked. Costs use API prices, not invoices. Intervals apply to each comparison individually.
Exact chart data and cost coverage
- Claude Opus 5, featured. Alternative passes 44/64 (68.8%); matched A-only passes 44/64 (68.8%).
- Claude Opus 5, other. Alternative passes 26/37 (70.3%); matched A-only passes 30/37 (81.1%).
- GPT-5.6 Sol. Alternative passes 23/37 (62.2%); matched A-only passes 30/37 (81.1%).
- GPT-6 Astra. Alternative passes 26/27 (96.3%); matched A-only passes 27/27 (100.0%). Estimated cost per success is 1.0% lower, with a 95% range from 14.0% lower to 14.0% higher. Source ratio 0.99 [0.86, 1.14]. Complete cost for 27/27 pairs (100.0%).
For GPT-5.6 Sol, the lower-effort chart shows a clear gap between the pass-rate bars. Lower effort left more tasks unfinished. That’s a quality trade-off, not a saving we can treat as free.
GPT-6 Astra offered little estimated saving. Its cost dot sits almost on the chart’s no-change line, and the uncertainty line extends to both sides. Even with complete cost data, the comparison doesn’t establish a saving. Its pass-rate bars also show a small drop at lower effort.
Cheaper model handoffs
ABB looks favorable in the featured strategy chart. Letting Claude Sonnet 5 finish produced a slightly higher observed pass rate than Claude Opus 5 alone, at lower estimated cost per success. Most rated pairs have complete cost data, though the estimate still excludes some.
ABA sits on the expensive side of that chart, despite matching A-only’s observed pass rate. A return to Claude Opus 5 for review raised estimated cost per success by 37% and did not raise the pass rate. The whole strategy also used more model calls. This doesn’t isolate the review stage’s effect. It does show that adding a return to A didn’t make the overall strategy economical in this condition.
The next chart puts the less favorable completion results beside the cost estimates. In another Claude Opus 5 trial group, ABB left substantially more tasks unfinished. That group has different tasks and execution settings, so it isn’t a repeat of the featured workload. Each comparison tests ABB against A-only on its own tasks, not the effect of changing only the execution settings.
Each alternative is compared with its own matched A-only baseline. These are different model pairs and trial groups, not a shared workload ranking.
How often did the task pass?
Alternative Matched A-only baseline
How much did cost per successful task change?
Left means cheaper. Right means more expensive. Dots are estimates; lines show 95% uncertainty ranges. A line crossing zero leaves both savings and higher cost plausible.
ABB hands off to Claude Sonnet 5 or 5.5. B alone uses GPT-5.6 Luna. The other Claude Opus 5 ABB group has 13 tasks, versus 22 in the featured group. Cost coverage is especially incomplete for GPT-5.6 Luna. Costs use API prices, not invoices. Intervals apply to each comparison individually.
Exact chart data and cost coverage
- Claude Opus 5, other ABB. Alternative passes 13/33 (39.4%); matched A-only passes 22/33 (66.7%).
- Claude Opus 5.5, ABB. Alternative passes 26/30 (86.7%); matched A-only passes 30/30 (100.0%). Estimated cost per success is 60.0% lower, with a 95% range from 70.0% lower to 41.0% lower. Source ratio 0.4 [0.3, 0.59]. Complete cost for 29/30 pairs (96.7%).
- GPT-5.6 Sol, B alone. Alternative passes 64/102 (62.7%); matched A-only passes 75/102 (73.5%). Estimated cost per success is 92.5% lower, with a 95% range from 94.2% lower to 90.5% lower. Source ratio 0.075 [0.058, 0.095]. Complete cost for 76/102 pairs (74.5%).
For a workload that can accept fewer completions, using B alone offers a more direct trade-off. In the largest GPT-5.6 Sol / GPT-5.6 Luna comparison, the handoff chart shows the price of that choice. GPT-5.6 Luna finished fewer tasks than GPT-5.6 Sol.
GPT-5.6 Luna’s cost estimate sits far to the cheaper side of the chart, but missing cost data limits how much we can conclude. Recorded tasks also took longer. A cheaper token price can still buy less completed work and a longer wait.
Cache reuse after switching
The token price alone misses part of the handoff’s cost. We broke down model-call usage in the featured Claude Opus 5 / Claude Sonnet 5 ABA comparison. This view includes failures and trials that stopped before reaching B. It’s a broader diagnostic population than the matched complete-cost pairs behind the strategy chart.
A cache read is input that the provider serves from a stored prompt cache at a lower price than new input. Consecutive calls to the same model read almost all their input tokens from cache. Calls after A handed off to B still reused most of their input. The return to A was different: little of that first call’s input came from cache, and much of it required new cache writes. The first call back to Claude Opus 5 after a handoff read 12.3% of input tokens from cache, against 95.3% for consecutive calls on one model. The figure below shows the drop in reuse. These are different requests at different stages of the task, not identical prompts replayed across models.
Claude Opus 5 / Claude Sonnet 5, ABA. 62 trials across 21 tasks in one condition.
- Consecutive same-model calls
- 95.3% read from cache 1,804 calls
- First call after A to B
- 86.7% read from cache 56 calls
- First call back to A
- 12.3% read from cache 45 calls
What if the return-call cache writes had been reads?
1,048,685 tokens, priced for Claude Opus 5
- Recorded usage, priced as writes
- $6.55
- Same tokens, hypothetical reads
- $0.52
- Hypothetical difference
- $6.03
Token-weighted shares, not matched causal effects. Dollar values use API prices. The hypothetical difference isn't a measured saving from avoiding the switch.
How much did those writes cost? Pricing the return-call writes as cache reads instead produces a $6.03 hypothetical difference. The figure compares those costs. It’s a sensitivity calculation, not a measured saving from avoiding the switch.
That difference puts a dollar value on the cache discount those return-call writes didn’t receive. It isn’t proof that switching threw away money we could’ve kept. New context, changed prompts, cache eligibility, and expiration can all require writes. We didn’t replay identical requests with and without a switch, so we can’t isolate the avoidable loss.
The first-return writes account for a substantial share of the known cache-write cost. Some attempts remain unpriced, so the breakdown isn’t a complete cohort total or a reconciled bill.
Cache reuse belongs in the routing budget alongside the number of calls and the final pass rate. Here, the return to A combined a more expensive model with much less cache reuse on its first call. That helps explain where the estimated cost went, without establishing how much of ABA’s higher cost a different routing policy would avoid.
Recommended starting point
We’d include lower effort in the first comparison for an agent workload. The controls show enough potential savings to make it worth measuring alongside a model change. They also show why it needs its own pass criteria.
If fewer completed tasks are acceptable, B-only makes that choice visible. If a handoff is being considered, keep ABB and ABA separate. A return to A must justify its cost through the final outcome, not through the reviewer’s own acceptance of the work.
The study leaves the more selective routing question open. A fixed switch after the first call doesn’t tell us which individual calls can safely move to B. Random switching gives us associations between route, call position, and eventual success, but earlier switches also change what the agent does next. We didn’t test isolated switches from identical agent states.
The cheap-first cascade is also a computed scenario, not a tested strategy. It combines B-only and A-only results under escalation assumptions. It doesn’t measure a system that detects B’s failure and then hands its actual work to A.
These are terminal-agent benchmark results, not a customer workload trial or validation of a production Tetrate Agent Router Enterprise policy. Our earlier routing experiment measured the cost and delay of selecting a model. This experiment measured what happened when the selected models did the work. The simple handoffs didn’t establish the general saving we were looking for; the controls give us specific alternatives to compare.
The next benchmark should test routing policies that use the task and the agent’s current state to decide when a cheaper model is likely to be sufficient. For Agent Router, the question is whether that more selective approach can preserve completion while reducing cost across workloads. These fixed handoffs and simpler controls give us baselines to test it against.
Method and limits
The main comparisons are descriptive. Their 95% intervals apply individually, not jointly across all the comparisons we examined. We assessed completion rates and costs separately to show where each approach saves money and what trade-offs come with it.
Results by model pair
The practical conclusion is to treat a fixed handoff as a workload-specific experiment, not a default cost-saving policy. Some comparisons reduced estimated cost, but others lost completions or took longer. In the featured comparison, returning to A added cost without increasing the pass rate. A cheaper model alone didn’t guarantee cheaper successful work.
The table separates those observed trade-offs from gaps in the evidence. A missing compatible comparison isn’t evidence that a handoff failed; it means that model pair doesn’t support a recommendation. These trial groups aren’t pooled. A matched cell is a task-and-repeat result available for both strategies under compatible recorded settings.
| Model pair and trial group | What we learned | Evidence and limit |
|---|---|---|
| GPT-6 Astra / GPT-6.1 Sol | Too few matched tasks to assess handoffs | The largest compatible ABA comparison has 7 matched cells over 3 tasks; ABB has 6 over 3. Both are below the declared interval minimum. |
| Claude Fable 5.1 / Claude Haiku 5.5 | Lower raw pass rates, without a reliable matched comparison | Marginal ABA outcomes are 48/72 (66.7%) and ABB 46/70 (65.7%) versus A-only 60/72 (83.3%) across different conditions. Compatible handoff comparisons are too small; one final random-arm rerun used incompatible execution settings. |
| Claude Opus 5.5 / Claude Haiku 5.5 | No compatible handoff comparison | No handoff pair survives the recorded-condition match. Lower-effort and B-only control comparisons have unverified saved agent versions and remain provisional. |
| Claude Opus 5.5 / Claude Sonnet 5.5 | Lower cost came with fewer completions | In the largest compatible condition, ABA passes 25/30 (83.3%) versus 30/30 (100.0%), a difference of -16.7 points [-32.4, -3.3]. ABB passes 26/30 (86.7%); its cost-per-success ratio is 0.40 [0.30, 0.59] on 29/30 (96.7%) complete-cost pairs. |
| GPT-6.1 Sol / GPT-6 Luna | B-only lost completions; handoff evidence is sparse | The largest ABA and ABB comparisons each have 7 matched cells over 3 tasks. The better-covered B-only control passes 14/21 (66.7%) versus 21/21 (100.0%). |
| GPT-6.1 Sol / Qwen3.8-27B | No compatible baseline or complete cost comparison | No rated B-only, ABA, ABB, or random contrast has a compatible matched A-only population. Complete compute-cost allocation is unavailable. |
| Claude Opus 4.8 / Claude Sonnet 4.6 | Handoffs lost completions in one condition | One condition has ABA and ABB each passing 6/16 (37.5%) versus A-only 11/16 (68.8%), a difference of -31.3 points [-62.5, -6.7]. Larger conditions are less decisive; many costs are missing. |
| Claude Opus 5 / Claude Sonnet 5, additional trial groups | ABA results varied; most costs are missing | The largest ABA comparison passes 15/54 (27.8%) versus 10/54 (18.5%); another passes 3/13 (23.1%) versus 6/13 (46.2%). Only 18/54 pairs (33.3%) in the largest comparison have complete cost. |
| Claude Opus 5 / Claude Sonnet 5, featured trial group and related comparisons | ABB varied by trial group; ABA cost more in the featured group | ABB passes 45/63 (71.4%) versus 43/63 (68.3%) in the main table, but 13/33 (39.4%) versus 22/33 (66.7%) elsewhere. ABA raises estimated cost per success in the main condition. Actual billed spend remains unreconciled. |
| GPT-5.6 Sol / GPT-5.6 Luna | Fewer completions and longer waits | The largest ABA comparison passes 60/100 (60.0%) versus 73/100 (73.0%); ABB passes 61/100 (61.0%) versus 72/100 (72.0%). Their success-difference intervals are [-24.5, -2.1] and [-20.4, -2.3] points. Both have wall-time ratios above 1 in those comparisons. |
| GPT-6.1 Sol / GLM-5.3-Flash | No routed trials to assess | Only 17/432 assigned cells (3.9%) were observed; 415/432 (96.1%) were never started. No routed result was observed. |
The Claude Opus 5 / Claude Sonnet 5 trial groups use the same named models but remain separate because their execution settings differ. Complete compute-cost evidence is also required where token prices don’t cover the cost of running a model.
The featured comparisons cover 22 distinct tasks except ABA, which covers 21. The other lower-effort Claude Opus 5 comparison covers 15 tasks, while the other ABB comparison covers 13. Differences in task mix and execution settings prevent treating these as repeated tests of the same workload.
How we measured
The API-equivalent view prices recorded usage, including cache reads and writes. These estimates don’t establish actual billed spend, and invoice allocation hasn’t been reconciled here. Complete compute-cost allocation, including startup and idle time, remains unavailable for some comparisons. A token-price estimate isn’t a measure of GPU spend, and reserved budgets aren’t charges.
Missing cost is particularly consequential when failures have incomplete usage. Complete-cost subsets can under-represent unsuccessful work. Some trial groups have especially incomplete cost evidence. Full run-level verification is available for 1,447/2,108 run scopes (68.6%); the remaining 661/2,108 (31.4%) have only partial verification.
The analysis uses 10,000 whole-task bootstrap resamples with seed 20261005. All repeats of a sampled task travel together. Absolute pass-rate intervals use Wilson intervals; paired differences and ratios use task-cluster percentile intervals. An interval is unavailable with fewer than four contributing tasks or fewer than 90% defined resamples. Model calls and repeats aren’t additional independent tasks.
For comparisons discussed above but not plotted with uncertainty, the featured lower-effort success difference is 0 percentage points [-12.3, +13.8]. Its model-call ratio is 0.63 [0.50, 0.76] and duration ratio is 0.78 [0.48, 1.03] across 64 matched pairs. The other lower-effort GPT-5.6 Sol success difference is -18.9 points [-35.3, -2.8]. Featured ABA has a model-call ratio of 1.59 [1.38, 1.87] across 60 pairs. GPT-5.6 Luna’s B-only success difference is -10.8 points [-20.8, -0.9], and its duration ratio is 1.11 [1.03, 1.20]. Brackets show pointwise 95% task-cluster intervals. Ratios compare the alternative with its matched A-only baseline.
These are pointwise descriptive intervals across many comparisons. They don’t establish a confirmatory winner or a causal ranking. The historical retention and cost targets aren’t the decision rule. Unanswered questions remain explicit in the analysis.
For the featured Claude Opus 5 / Claude Sonnet 5 ABA comparison, the first A-to-B calls read 244,598/282,146 measured input tokens (86.7%) from cache across 56 calls. First B-to-A calls read 147,628/1,196,403 tokens (12.3%) from cache across 45 calls. These observations came from 62 trials. The cost breakdown retains uncached input, cache reads, cache writes by lifetime, output, and recorded retries.
Those trials cover 21 tasks, a broader diagnostic population than the 56 matched complete-cost pairs in the strategy comparison. The first-return calls wrote 1,048,685 tokens to the five-minute cache. At Claude Opus 5 rates of $6.25 per million write tokens and $0.50 per million read tokens, those writes cost $6.55 versus $0.52 for hypothetical reads. The difference is $6.03, or about $0.134 per return call. The equivalent write-to-read difference on the first calls to B is $0.086 across all 56 calls.
Across the 1,967 priced model attempts in these trials, cache reads cost $13.99, five-minute cache writes $15.08, output $19.02, and uncached input about $0.01. The known subtotal is $48.11. Two of the 1,969 attempts (0.1%) lack a returned model identity and remain unpriced. The first-return writes account for 43.5% of the known cache-write cost. Cache shares are token-weighted, not averages across calls.
The call-level analysis contains 2,795 condition-specific random-arm groups by call position or preceding step type. Of those, 775/2,795 (27.7%) have valid task-cluster intervals and 2,020/2,795 (72.3%) have explicit insufficient-data reasons. These associations with downstream success don’t establish the effect of an isolated call replacement.
Which trials counted
The evidence cutoff is November 14, 2026 at 06:36:52.589429 UTC. A cell is one assigned task, repeat, and strategy. Across the requested inventory, 7,145/7,560 assigned cells (94.5%) were observed. The remaining 415/7,560 (5.5%) belong to the largely unstarted GLM set. These are inventory counts, not pooled pass rates. Earlier model sets use 24 assigned tasks each; the larger sets use 63. Task overlap, ceiling and floor outcomes, and condition compatibility limit how much information each comparison contains.
Each cell’s effective result is the last observed run in its repair chain, whatever its outcome. An unobserved retry can’t replace an observed failure. Original-only results and cumulative known chain-cost lower bounds remain separate sensitivity views. A successful repair doesn’t erase its predecessor.
The Claude Opus 5 / Claude Sonnet 5 trial group used in the main comparisons has effective results from iteration 1 for 1,066/1,134 cells (94.0%), iteration 2 for 62/1,134 (5.5%), iteration 3 for 1/1,134 (0.1%), and iteration 4 for 5/1,134 (0.4%). The final retry round leaves 3/5 infrastructure NULLs (60.0%), including two sandbox failures and one agent-run failure associated with upstream service trouble. The other 2/5 (40.0%) are scored failures. They stay as recorded. Recovered records add existing evidence, not new model calls. The changed execution settings in the Claude Fable 5.1 rerun remain a condition difference.
Refusals, unscored task wall timeouts, and unclosed work units count as rated failures. A valid final grade takes precedence over an incidental wall-limit flag; recorded wall-limit exposure remains visible in duration comparisons. Other unscored incidents remain NULL and drop out of matched rated comparisons, with their reasons retained. For example, the main lower-effort Claude Opus 5 comparison has 64/65 potential same-condition pairs (98.5%) with rated outcomes; one pair is NULL. Of those 64 rated pairs, 3/64 (4.7%) lack complete cost. Missing cost isn’t zero.
The main cost ratios use the selected effective trial, including every recorded model attempt within it. Earlier runs replaced by a collection repair aren’t included in those ratios. Original-only results and the known cumulative costs of earlier and effective runs remain separate checks. Their missing costs prevent a complete repair-chain total.
The trial clock runs from recorded start to end, including grading and recorded waits. Failed and time-limited trials stay in the duration comparison. Startup, queueing outside that interval, and teardown need separate accounting. Actual concurrent load isn’t established by the saved metadata, so these duration ratios aren’t measurements of intrinsic model speed.
The task split avoids tuning the routing conditions on final task outcomes. It doesn’t establish that the tasks were unseen: the project had prior source and verifier exposure, and model-training exposure is unknown. Hidden verifier contents remain outside the acting agent’s view. Same-model observations are stability diagnostics, not proof that task mix, execution settings, or load differences have been removed.
Frequently asked questions
What is a model step-down for an AI agent?
A model step-down moves an agent task from a strong model to a cheaper model, or to a lower reasoning effort setting on the same model, to cut cost. A step-down pays off only when the agent still finishes the task. Tetrate measures a step-down by cost per success, not by token price.
What is cost per success?
Cost per success is the total estimated cost of all runs, failed runs included, divided by the number of runs that passed an independent verifier. Failed work stays in the total. A cheap run that fails raises cost per success.
Does lower reasoning effort reduce agent cost?
In Tetrate’s November 2026 benchmark, Claude Opus 5 at low reasoning effort had a 61% lower estimated cost per success than at high effort: $0.297 against $0.770. Both settings passed 44 of 64 runs. The result did not repeat in every group. GPT-5.6 Sol at low effort passed 23 of 37 runs, against 30 of 37 at standard effort.
Can a cheaper model finish a task that a stronger model started?
Sometimes. In one group, Claude Sonnet 5 finished tasks that Claude Opus 5 started, with a 48% lower estimated cost per success and a pass rate of 71.4% against 68.3%. In a second group with different tasks, the same handoff passed 39.4% of runs against 66.7% for Claude Opus 5 alone. Test the handoff on your own workload.
Should a strong model review the work of a cheaper model?
In Tetrate’s benchmark, a return to Claude Opus 5 for review after Claude Sonnet 5 worked raised estimated cost per success by 37%. The pass rate did not change: 40 of 60 runs passed with review and 40 of 60 passed with Claude Opus 5 alone. The test did not isolate the effect of the review stage.
Does switching models in the middle of a task affect prompt caching?
Tetrate’s data shows lower cache reuse after a switch back. The first call back to Claude Opus 5 read 12.3% of input tokens from cache. Consecutive calls on one model read 95.3%. Claude Opus 5 cache writes are priced at $6.25 per million tokens and cache reads at $0.50 per million, so low cache reuse raises the cost of the return call.
Does a cheaper model finish as many agent tasks?
Often no. GPT-5.6 Luna alone had a 92.5% lower estimated cost per success than GPT-5.6 Sol, and passed 64 of 102 runs against 75 of 102. Runs on GPT-5.6 Luna also took 11% longer. A lower price per token can come with fewer finished tasks and longer waits.
Related: earlier routing experiment with Jev.
Nick DiZazzo